Prometheus and Grafana: Comprehensive System Monitoring
09 Jan 2024
by Tan Wei Shane, Software Engineer & Asrul Ash
09 Jan 2024
by Tan Wei Shane, Software Engineer & Asrul Ash
Prometheus and Grafana: Comprehensive System Monitoring
Table of contents
Contact us
We will get back to you in the next 48 hours.
Prometheus and Grafana_ Comprehensive System Monitoring
How does Prometheus and Grafana integrate with each other? How do you use Prometheus and Grafana together? Dive deep here!
Follow Lizard Global on Facebook, Instagram, and LinkedIn.
In today's fast-paced world of digital systems, the need for effective monitoring and alerting has never been more crucial. As organizations navigate the ever-evolving landscape of technology, ensuring the seamless and reliable operation of digital systems is paramount to success.
Imagine a monitoring system that not only keeps your digital systems in check but also enhances your understanding of their performance. Prometheus and Grafana go beyond the ordinary, offering a comprehensive solution that sparks a desire for a more intuitive, transparent, and efficient approach to project monitoring. The seamless integration of these tools is designed to make you yearn for a monitoring experience that adapts to the complexities of the modern digital landscape.
To discover how these tools can elevate your monitoring practices, this blog post delves into the transformative capabilities of Prometheus and Grafana, a dynamic open-source duo that stands at the forefront of revolutionizing project monitoring.
What is Prometheus and how does it work?
Prometheus is an open-source systems monitoring and alerting toolkit that plays a pivotal role in ensuring the robustness of your digital infrastructure. Acting as the backbone, Prometheus operates as a collaborative set of tools, empowering users with the capability to meticulously oversee their digital systems, guaranteeing both seamless operation and prompt alerts.
Prometheus takes monitoring to the next level by collecting and storing metrics as time-series data, accompanied by the integration of key-value pairs known as labels. Metrics, serving as quantitative data points, offer profound insights into the behavior of your system. The incorporation of time-series data facilitates trend analysis, anomaly identification, and informed decision-making. Each data point is meticulously associated with a timestamp, allowing for a comprehensive understanding of system dynamics over time.
Adding an additional layer of sophistication, Prometheus utilizes labels to enhance the metadata associated with metrics. This ingenious feature significantly simplifies data filtering and querying processes. The inclusion of labels not only enriches the information available but also elevates the overall manageability of the monitoring process. With Prometheus, the intricacies of your digital systems are not just monitored; they are meticulously understood, allowing for a more nuanced and insightful approach to system management.
The 6 components of Prometheus
The Prometheus ecosystem encompasses several elements, with many being optional:
- The primary Prometheus server, responsible for scraping and storing time series data.
- Client libraries designed for instrumenting application code.
- A push gateway that supports short-lived jobs.
- Special-purpose exporters catering to services such as HAProxy, StatsD, Graphite, etc.
- An alert manager dedicated to handling alerts.
- Various support tools to enhance functionality.
The majority of Prometheus components are coded in Go, facilitating straightforward building and deployment as static binaries.
The Prometheus Architecture
This visual representation outlines the architecture of Prometheus and its ecosystem components:
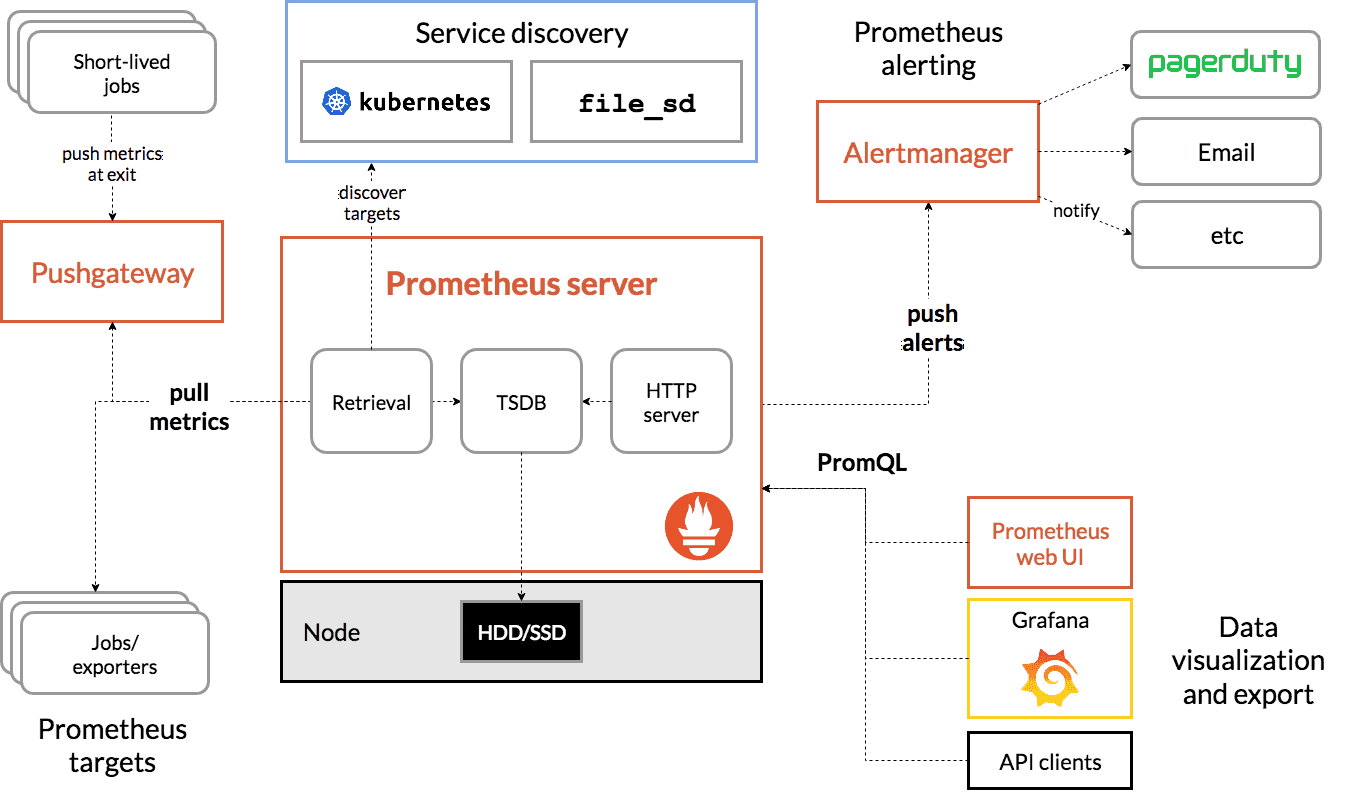
Prometheus extracts metrics from instrumented jobs, either through direct means or with the help of a push gateway for short-lived tasks. It locally stores all collected samples, executing rules to aggregate and record new time series or generate alerts based on the data. Visualization of the amassed information can be accomplished using Grafana or other API consumers.
What is Grafana and how is it used?
Grafana emerges as a gem that seamlessly complements Prometheus, contributing to an unparalleled monitoring and visualization experience. Grafana's primary role is to offer an interactive platform for visualizing a diverse range of data, including metrics, logs, and traces, irrespective of their storage location.
The true power of Grafana lies in its adaptive nature, exemplified through its Open Source Software (OSS) Plugin Framework. This framework serves as the gateway to Grafana's versatility, allowing it to establish seamless connections with various data sources. Whether it's NoSQL or SQL databases, ticketing tools like Jira or ServiceNow, or CI/CD tools such as GitLab, Grafana's plugin framework ensures a harmonious integration.
What sets Grafana apart is its commitment to providing a unified and holistic approach to data visualization. The flexibility embedded in the plugin framework means that Grafana becomes the central hub where disparate data sources converge into meaningful and coherent visual representations. This adaptability not only simplifies the process of data interpretation but also offers a comprehensive view of the entire digital landscape.
How does Prometheus and Grafana integrate with each other?
The amalgamation of Prometheus and Grafana creates more than just a monitoring solution—it forms a dynamic and robust observability synergy. Prometheus takes on the crucial tasks of collection, storage, and alerting, ensuring that real-time and historical data are meticulously handled. Meanwhile, Grafana steps into the scene, providing visually captivating and dynamic dashboards that elevate the exploration and analysis of the collected metrics.
1. A perfect fit for dynamic environments
This monitoring stack isn't just a one-size-fits-all solution; it's specifically tailored for the challenges posed by dynamic and containerized environments. In scenarios orchestrated by tools like Kubernetes, Prometheus, and Grafana shine. Their combined adaptability, scalability, and dynamic service discovery capabilities make them the go-to choice in the intricate landscapes of modern, cloud-native infrastructures.
2. Adaptability for the win
The beauty of this synergy lies in its adaptability. Prometheus seamlessly adapts to the evolving needs of the system, efficiently collecting and storing data while providing timely alerts. On the other hand, Grafana's dynamic dashboards flexibly adjust to the changing metrics landscape, offering an ever-evolving visual narrative of the system's performance.
3. Scalability: growing with your needs
As your projects expand and the volume of data increases, Prometheus and Grafana stand ready. Their scalability ensures that the monitoring solution grows alongside your dynamic environment, accommodating heightened data loads and evolving infrastructural complexities without compromising efficiency.
4. Dynamic service discovery: navigating complexity with ease
In modern infrastructures, service discovery is a game-changer. Prometheus, coupled with Grafana, excels in dynamic service discovery, effortlessly adapting to changes in the system architecture and ensuring that monitoring remains seamless even in the face of evolving service landscapes.
🧐 How much does it cost to build an app in 2024? Fulfill your curiosity with our App Cost Estimator. Totally FREE! Click, calculate, and get ready for the appventure of a lifetime.
How do you use Prometheus and Grafana together?
Similar to the broader context presented earlier, Lizard Global has strategically embraced Prometheus and Grafana to elevate its project monitoring capabilities in the face of expanding projects. Following are our monitoring practices used for each project and development:
1. Harnessing comprehensive metrics with Prometheus:
With Prometheus at the helm, it has become the cornerstone of monitoring practices. The tool enables the company to gather comprehensive metrics, offering a granular view of project health and performance. This granular insight empowers Lizard Global to proactively address potential challenges and maintain the high standards expected in their project delivery.
2. Intuitive visualization for enhanced understanding through Grafana
Taking project monitoring to the next level, Grafana steps in by offering an intuitive platform for visualizing data. This isn't just an internal enhancement—Grafana extends a new level of transparency directly to our clients. Now, our clients have direct access to a dynamic dashboard that offers a crystal-clear overview of the project's status. Grafana's visual appeal transforms complex data into a comprehensible narrative, fostering a sense of transparency and collaboration.
3. Navigating client-centric engagement
What sets Lizard Global's monitoring strategy apart is the deliberate effort to extend visibility directly to clients. With Grafana dashboards, clients now have direct access to a clear and easily understandable overview of project status. This transparent approach fosters continuous client engagement, keeping them informed about ongoing developments. In the event of issues or alerts, Lizard Global's clients receive real-time notifications, enabling a proactive response and ensuring that challenges are addressed promptly.
4. Strengthening internal collaborative monitoring
Beyond the external benefits, the adoption of Prometheus and Grafana has significantly strengthened our internal processes. The collaboration between these tools forms a robust monitoring solution that seamlessly integrates with our workflows. This internal synergy ensures that our teams are equipped with the tools needed to respond swiftly to any potential issues, contributing to the overall efficiency and reliability of our projects.
Prometheus and Grafana: Revolutionizing system monitoring
In the final analysis, Prometheus emerges as a powerful system monitoring application, diligently polling client systems for crucial metrics. However, its true potential is unlocked when paired with the sophisticated visualization capabilities of Grafana. Grafana seamlessly imports metrics from Prometheus, presenting them through an intuitively structured dashboard.
To bring these components together seamlessly, initiate the integration process by downloading and installing Prometheus on a central server. Configure Prometheus as a service and install the Prometheus Node Exporter on each client to collect and expose the required data. Configure Prometheus to actively poll the clients. On the same server as Prometheus, install Grafana and set up Prometheus as a data source. Finally, import a dashboard to vividly display the metrics derived from the client systems.
For a comprehensive understanding of Prometheus, delve into the Prometheus Overview and Documentation. Meanwhile, to grasp the intricacies of Grafana, explore the Introduction to Grafana. This integration promises not just efficient monitoring but a transformative experience in visualizing and understanding critical system metrics.
👀 How much does it cost to build an app in 2024? Let's crunch numbers together!
We get it, pricing can be a puzzler. But fear not! Our App Cost Estimator tool is here to sprinkle a bit of magic on your budgeting journey. It's as easy as picking your features and voilà—your app investment laid out in front of you. Click, calculate, and get ready for the appventure of a lifetime.
Want to find out how much it costs to build your dream app or web app?

Prometheus and Grafana_ Comprehensive System Monitoring
How does Prometheus and Grafana integrate with each other? How do you use Prometheus and Grafana together? Dive deep here!
Follow Lizard Global on Facebook, Instagram, and LinkedIn.
In today's fast-paced world of digital systems, the need for effective monitoring and alerting has never been more crucial. As organizations navigate the ever-evolving landscape of technology, ensuring the seamless and reliable operation of digital systems is paramount to success.
Imagine a monitoring system that not only keeps your digital systems in check but also enhances your understanding of their performance. Prometheus and Grafana go beyond the ordinary, offering a comprehensive solution that sparks a desire for a more intuitive, transparent, and efficient approach to project monitoring. The seamless integration of these tools is designed to make you yearn for a monitoring experience that adapts to the complexities of the modern digital landscape.
To discover how these tools can elevate your monitoring practices, this blog post delves into the transformative capabilities of Prometheus and Grafana, a dynamic open-source duo that stands at the forefront of revolutionizing project monitoring.
What is Prometheus and how does it work?
Prometheus is an open-source systems monitoring and alerting toolkit that plays a pivotal role in ensuring the robustness of your digital infrastructure. Acting as the backbone, Prometheus operates as a collaborative set of tools, empowering users with the capability to meticulously oversee their digital systems, guaranteeing both seamless operation and prompt alerts.
Prometheus takes monitoring to the next level by collecting and storing metrics as time-series data, accompanied by the integration of key-value pairs known as labels. Metrics, serving as quantitative data points, offer profound insights into the behavior of your system. The incorporation of time-series data facilitates trend analysis, anomaly identification, and informed decision-making. Each data point is meticulously associated with a timestamp, allowing for a comprehensive understanding of system dynamics over time.
Adding an additional layer of sophistication, Prometheus utilizes labels to enhance the metadata associated with metrics. This ingenious feature significantly simplifies data filtering and querying processes. The inclusion of labels not only enriches the information available but also elevates the overall manageability of the monitoring process. With Prometheus, the intricacies of your digital systems are not just monitored; they are meticulously understood, allowing for a more nuanced and insightful approach to system management.
The 6 components of Prometheus
The Prometheus ecosystem encompasses several elements, with many being optional:
- The primary Prometheus server, responsible for scraping and storing time series data.
- Client libraries designed for instrumenting application code.
- A push gateway that supports short-lived jobs.
- Special-purpose exporters catering to services such as HAProxy, StatsD, Graphite, etc.
- An alert manager dedicated to handling alerts.
- Various support tools to enhance functionality.
The majority of Prometheus components are coded in Go, facilitating straightforward building and deployment as static binaries.
The Prometheus Architecture
This visual representation outlines the architecture of Prometheus and its ecosystem components:
Prometheus extracts metrics from instrumented jobs, either through direct means or with the help of a push gateway for short-lived tasks. It locally stores all collected samples, executing rules to aggregate and record new time series or generate alerts based on the data. Visualization of the amassed information can be accomplished using Grafana or other API consumers.
What is Grafana and how is it used?
Grafana emerges as a gem that seamlessly complements Prometheus, contributing to an unparalleled monitoring and visualization experience. Grafana's primary role is to offer an interactive platform for visualizing a diverse range of data, including metrics, logs, and traces, irrespective of their storage location.
The true power of Grafana lies in its adaptive nature, exemplified through its Open Source Software (OSS) Plugin Framework. This framework serves as the gateway to Grafana's versatility, allowing it to establish seamless connections with various data sources. Whether it's NoSQL or SQL databases, ticketing tools like Jira or ServiceNow, or CI/CD tools such as GitLab, Grafana's plugin framework ensures a harmonious integration.
What sets Grafana apart is its commitment to providing a unified and holistic approach to data visualization. The flexibility embedded in the plugin framework means that Grafana becomes the central hub where disparate data sources converge into meaningful and coherent visual representations. This adaptability not only simplifies the process of data interpretation but also offers a comprehensive view of the entire digital landscape.
How does Prometheus and Grafana integrate with each other?
The amalgamation of Prometheus and Grafana creates more than just a monitoring solution—it forms a dynamic and robust observability synergy. Prometheus takes on the crucial tasks of collection, storage, and alerting, ensuring that real-time and historical data are meticulously handled. Meanwhile, Grafana steps into the scene, providing visually captivating and dynamic dashboards that elevate the exploration and analysis of the collected metrics.
1. A perfect fit for dynamic environments
This monitoring stack isn't just a one-size-fits-all solution; it's specifically tailored for the challenges posed by dynamic and containerized environments. In scenarios orchestrated by tools like Kubernetes, Prometheus, and Grafana shine. Their combined adaptability, scalability, and dynamic service discovery capabilities make them the go-to choice in the intricate landscapes of modern, cloud-native infrastructures.
2. Adaptability for the win
The beauty of this synergy lies in its adaptability. Prometheus seamlessly adapts to the evolving needs of the system, efficiently collecting and storing data while providing timely alerts. On the other hand, Grafana's dynamic dashboards flexibly adjust to the changing metrics landscape, offering an ever-evolving visual narrative of the system's performance.
3. Scalability: growing with your needs
As your projects expand and the volume of data increases, Prometheus and Grafana stand ready. Their scalability ensures that the monitoring solution grows alongside your dynamic environment, accommodating heightened data loads and evolving infrastructural complexities without compromising efficiency.
4. Dynamic service discovery: navigating complexity with ease
In modern infrastructures, service discovery is a game-changer. Prometheus, coupled with Grafana, excels in dynamic service discovery, effortlessly adapting to changes in the system architecture and ensuring that monitoring remains seamless even in the face of evolving service landscapes.
🧐 How much does it cost to build an app in 2024? Fulfill your curiosity with our App Cost Estimator. Totally FREE! Click, calculate, and get ready for the appventure of a lifetime.
How do you use Prometheus and Grafana together?
Similar to the broader context presented earlier, Lizard Global has strategically embraced Prometheus and Grafana to elevate its project monitoring capabilities in the face of expanding projects. Following are our monitoring practices used for each project and development:
1. Harnessing comprehensive metrics with Prometheus:
With Prometheus at the helm, it has become the cornerstone of monitoring practices. The tool enables the company to gather comprehensive metrics, offering a granular view of project health and performance. This granular insight empowers Lizard Global to proactively address potential challenges and maintain the high standards expected in their project delivery.
2. Intuitive visualization for enhanced understanding through Grafana
Taking project monitoring to the next level, Grafana steps in by offering an intuitive platform for visualizing data. This isn't just an internal enhancement—Grafana extends a new level of transparency directly to our clients. Now, our clients have direct access to a dynamic dashboard that offers a crystal-clear overview of the project's status. Grafana's visual appeal transforms complex data into a comprehensible narrative, fostering a sense of transparency and collaboration.
3. Navigating client-centric engagement
What sets Lizard Global's monitoring strategy apart is the deliberate effort to extend visibility directly to clients. With Grafana dashboards, clients now have direct access to a clear and easily understandable overview of project status. This transparent approach fosters continuous client engagement, keeping them informed about ongoing developments. In the event of issues or alerts, Lizard Global's clients receive real-time notifications, enabling a proactive response and ensuring that challenges are addressed promptly.
4. Strengthening internal collaborative monitoring
Beyond the external benefits, the adoption of Prometheus and Grafana has significantly strengthened our internal processes. The collaboration between these tools forms a robust monitoring solution that seamlessly integrates with our workflows. This internal synergy ensures that our teams are equipped with the tools needed to respond swiftly to any potential issues, contributing to the overall efficiency and reliability of our projects.
Prometheus and Grafana: Revolutionizing system monitoring
In the final analysis, Prometheus emerges as a powerful system monitoring application, diligently polling client systems for crucial metrics. However, its true potential is unlocked when paired with the sophisticated visualization capabilities of Grafana. Grafana seamlessly imports metrics from Prometheus, presenting them through an intuitively structured dashboard.
To bring these components together seamlessly, initiate the integration process by downloading and installing Prometheus on a central server. Configure Prometheus as a service and install the Prometheus Node Exporter on each client to collect and expose the required data. Configure Prometheus to actively poll the clients. On the same server as Prometheus, install Grafana and set up Prometheus as a data source. Finally, import a dashboard to vividly display the metrics derived from the client systems.
For a comprehensive understanding of Prometheus, delve into the Prometheus Overview and Documentation. Meanwhile, to grasp the intricacies of Grafana, explore the Introduction to Grafana. This integration promises not just efficient monitoring but a transformative experience in visualizing and understanding critical system metrics.
👀 How much does it cost to build an app in 2024? Let's crunch numbers together!
We get it, pricing can be a puzzler. But fear not! Our App Cost Estimator tool is here to sprinkle a bit of magic on your budgeting journey. It's as easy as picking your features and voilà—your app investment laid out in front of you. Click, calculate, and get ready for the appventure of a lifetime.
Want to find out how much it costs to build your dream app or web app?
FAQs
Can Prometheus handle complex, multi-tiered system architectures effectively?
What security measures does Grafana offer for client access to dashboards?
How does Prometheus address scalability challenges in rapidly expanding projects?
Can Grafana integrate with other monitoring tools besides Prometheus?
Is there a learning curve associated with implementing Prometheus and Grafana for project monitoring?
similar reads

Case Studies & Interviews
Lereng Tanah: Developing a Direct Booking Platform Malaysian Boutique Villa
29 January 2026

Software Development/Salesforce CRM
Integrating CRM Systems With Lizard Global
22 February 2023

Case Studies & Interviews
Tactlink: How a Malaysian Entrepreneur Turned Networking Chaos into a Digital Community
22 January 2026
Stuck between a great idea and the right team to build it?Let's talk.
We work with corporate innovation teams and ambitious scale-ups across the Netherlands, Singapore, and Australia, and wherever great software needs to be built. Drop us a message and we'll get back to you within one business day.


Markus Monnikendam
Global Commercial Director
hello@lizard.global