What Is Lean Analytics, Its Benefits & How To Implement It?
31 May 2024
by Lotte, Digital Content Specialist & Nadiy, Content Writer
31 May 2024
by Lotte, Digital Content Specialist & Nadiy, Content Writer
What Is Lean Analytics, Its Benefits & How To Implement It?
Table of contents
Contact us
We will get back to you in the next 48 hours.
What Is Lean Analytics, Its Benefits & How To Implement It?
In this blog we dive into the topic of Lean Analytics. We share with you, what it is, what are its benefits, and how you can implement it.
key takeaways
If you’ve been reading through some of our blogs, you’ve probably come across the term Lean Startup, that describes the term as an agile approach for structuring the progress of your business and continuously adapting strategies where needed. The Lean Startup approach forms one of the cornerstones of our business processes within Lizard Global.
In order to measure the actual progress of your business, you’ll need a solid methodology to work with and this is where Lean Analytics comes in. Before diving deep into how it is used and what are the tools for it, you must first understand what lean analytics is.
What is Lean Analytics?
‘Lean Analytics’ is a term coined by Benjamin Yoskovitz and Alistair Croll in their book of the same name, and can be defined as an extension of the Lean Startup approach. It is used to measure the growth and success of your business by analyzing the maturity phase of your product and the specific actions and metrics that drive the right kind of growth during that stage.
At Lizard Global, we use Lean Analytics to optimize our agile ways of working, and the overall growth of your business by leveraging off of data to make the best decisions. Building technology is just a first step. In order to turn your solution into a successful product, it’s crucial to set the right KPIs, which are going to be dependent on your target audience, the type of technology you have, and the current stage of your business. By carefully picking your KPIs and tracking them, you enable your business to measure its performance and instantly act upon your analyzed data.
What are the benefits of applying Lean Analytics?
There are numerous benefits of applying lean analytics. Having worked with lean analytics for years, the experts at Lizard Global have narrowed it down to 5 recurring benefits they’ve observed over the years.
Here are the 5 benefits of applying lean analytics:
Increases decision-making efficiency: Businesses are given the upper hand in improving their decision-making by focusing on data-driven insights.
A great example of this is the use of A/B testing to test out the best option for a call-to-action (CTA) button. Instead of relying only on intuition or looking at what competitors are doing, businesses are able to analyze their customer’s interaction with the different CTA buttons - version A vs version B. The data obtained here will enable businesses to determine which version resonated more with their customers then leading the business to implement it and in return garner more sales.
Enhances scalability: With lean analytics businesses are able to identify strategies that are scalable through data.
For example, a business’ experimentation with SaaS to determine which can be used to best attract retain customers. The business then creates a few types of subscription plan - free, monthly, and annually. Based on the data collected the business notices the higher retention and lower churn rate compared to the other two subscription plans. This enables the business to then focus on promoting their annual plan which aids in the scalability of their company.
Reduction in risk: Business risk is reduced through the possibility of making early and often assumptions that also helps avoid costly mistakes.
Take an e-commerce business making a hypothesis that there will be an increase in their sales if they offer free shipping. Before going full blast and implementing the free shipping they decide to run a limited-time free shipping promotion for selected products and they observe their sales data. The results indicate that there was not only an increase in sales for that particular product but also an increase in the order value. This gives them the information needed to then implement free shipping for all products, reducing their risk of loss from an untested assumption.
Ever wondered how an E-commerce business is started? Read our blog How Do You Start An Ecommerce Business In Malaysia?
Better customer focus: Businesses are able to remain aligned with their customer needs and behaviors through the data collected.
Let’s take a look at mobile app developers for this example where they conduct comprehensive analysis to better understand user behavior. With this analysis they discover that there is a significantly higher retention rate when customers complete the tutorial than those who don’t. The company then redesigns the onboarding process to ensure the tutorial is not only more engaging but also mandatory leading to an increase in their user retention.
Optimization of resources: Resources can be better allocated through focusing on the areas that are most impactful for the business.
A great example of this is, imagine a marketing team that has a limited budget to with but they want to maximize their return on investment (ROI). How do they do this? They start with tracking the performance of their marketing channels like their social media, paid search, email marketing etc. They find that out of all the areas they’ve focused on, the one that garners the most conversion rates and is at a cheaper cost is email marketing. This allows them to allocate more budget to their email marketing giving them an increase in profit without having to increase the cost for it.
Find out how you can improve your email marketing
Tools In Lean Analytics
The One Metrics That Matters (OMTM)
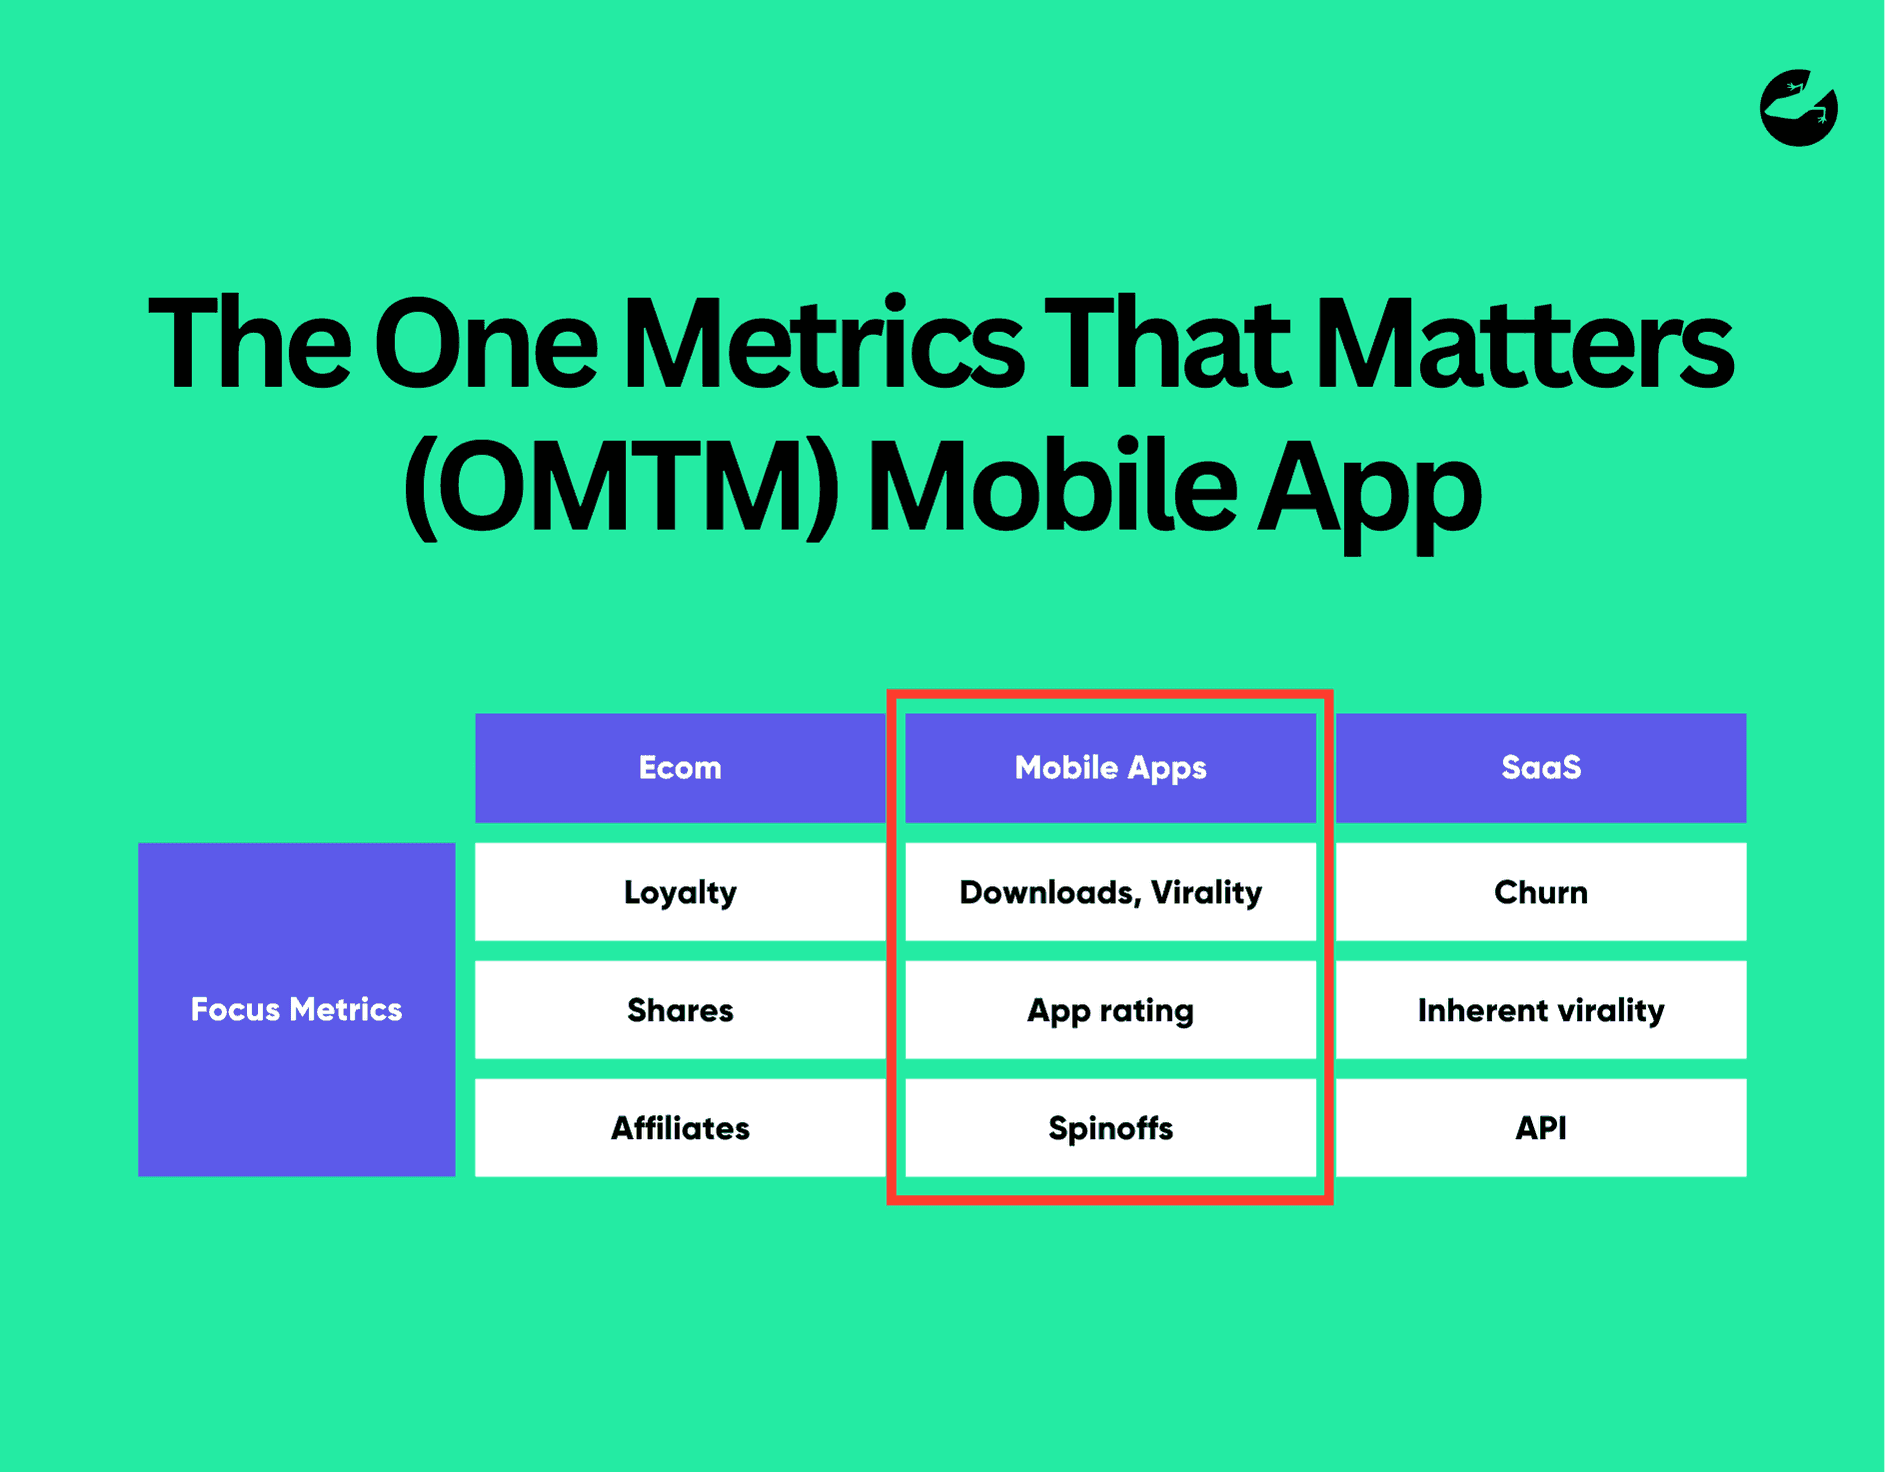
The most essential tool we use during the process of Lean Analytics is the One Metrics That Matters (OMTM), which we apply to help determine the right KPIs tailored to your solution and pinned objectives.
It’s all about finding the right thing to track at the right time, based on factors such as the current state of your business, type of business, and the industry you’re active in. The OMTM supports us to create and encourage focus and keeps our team on track regarding measuring growth and success.
An example of OMTM for mobile apps will be the Daily Active Users (DAU), the reason this is the focus area is because a high user engagement is crucial to an app’s success. With this success the app then has the ability to increase its revenue with opportunities in adding ads or in-app purchases.
Want to find out how much it costs to build your dream app or web app?

The Hook Model
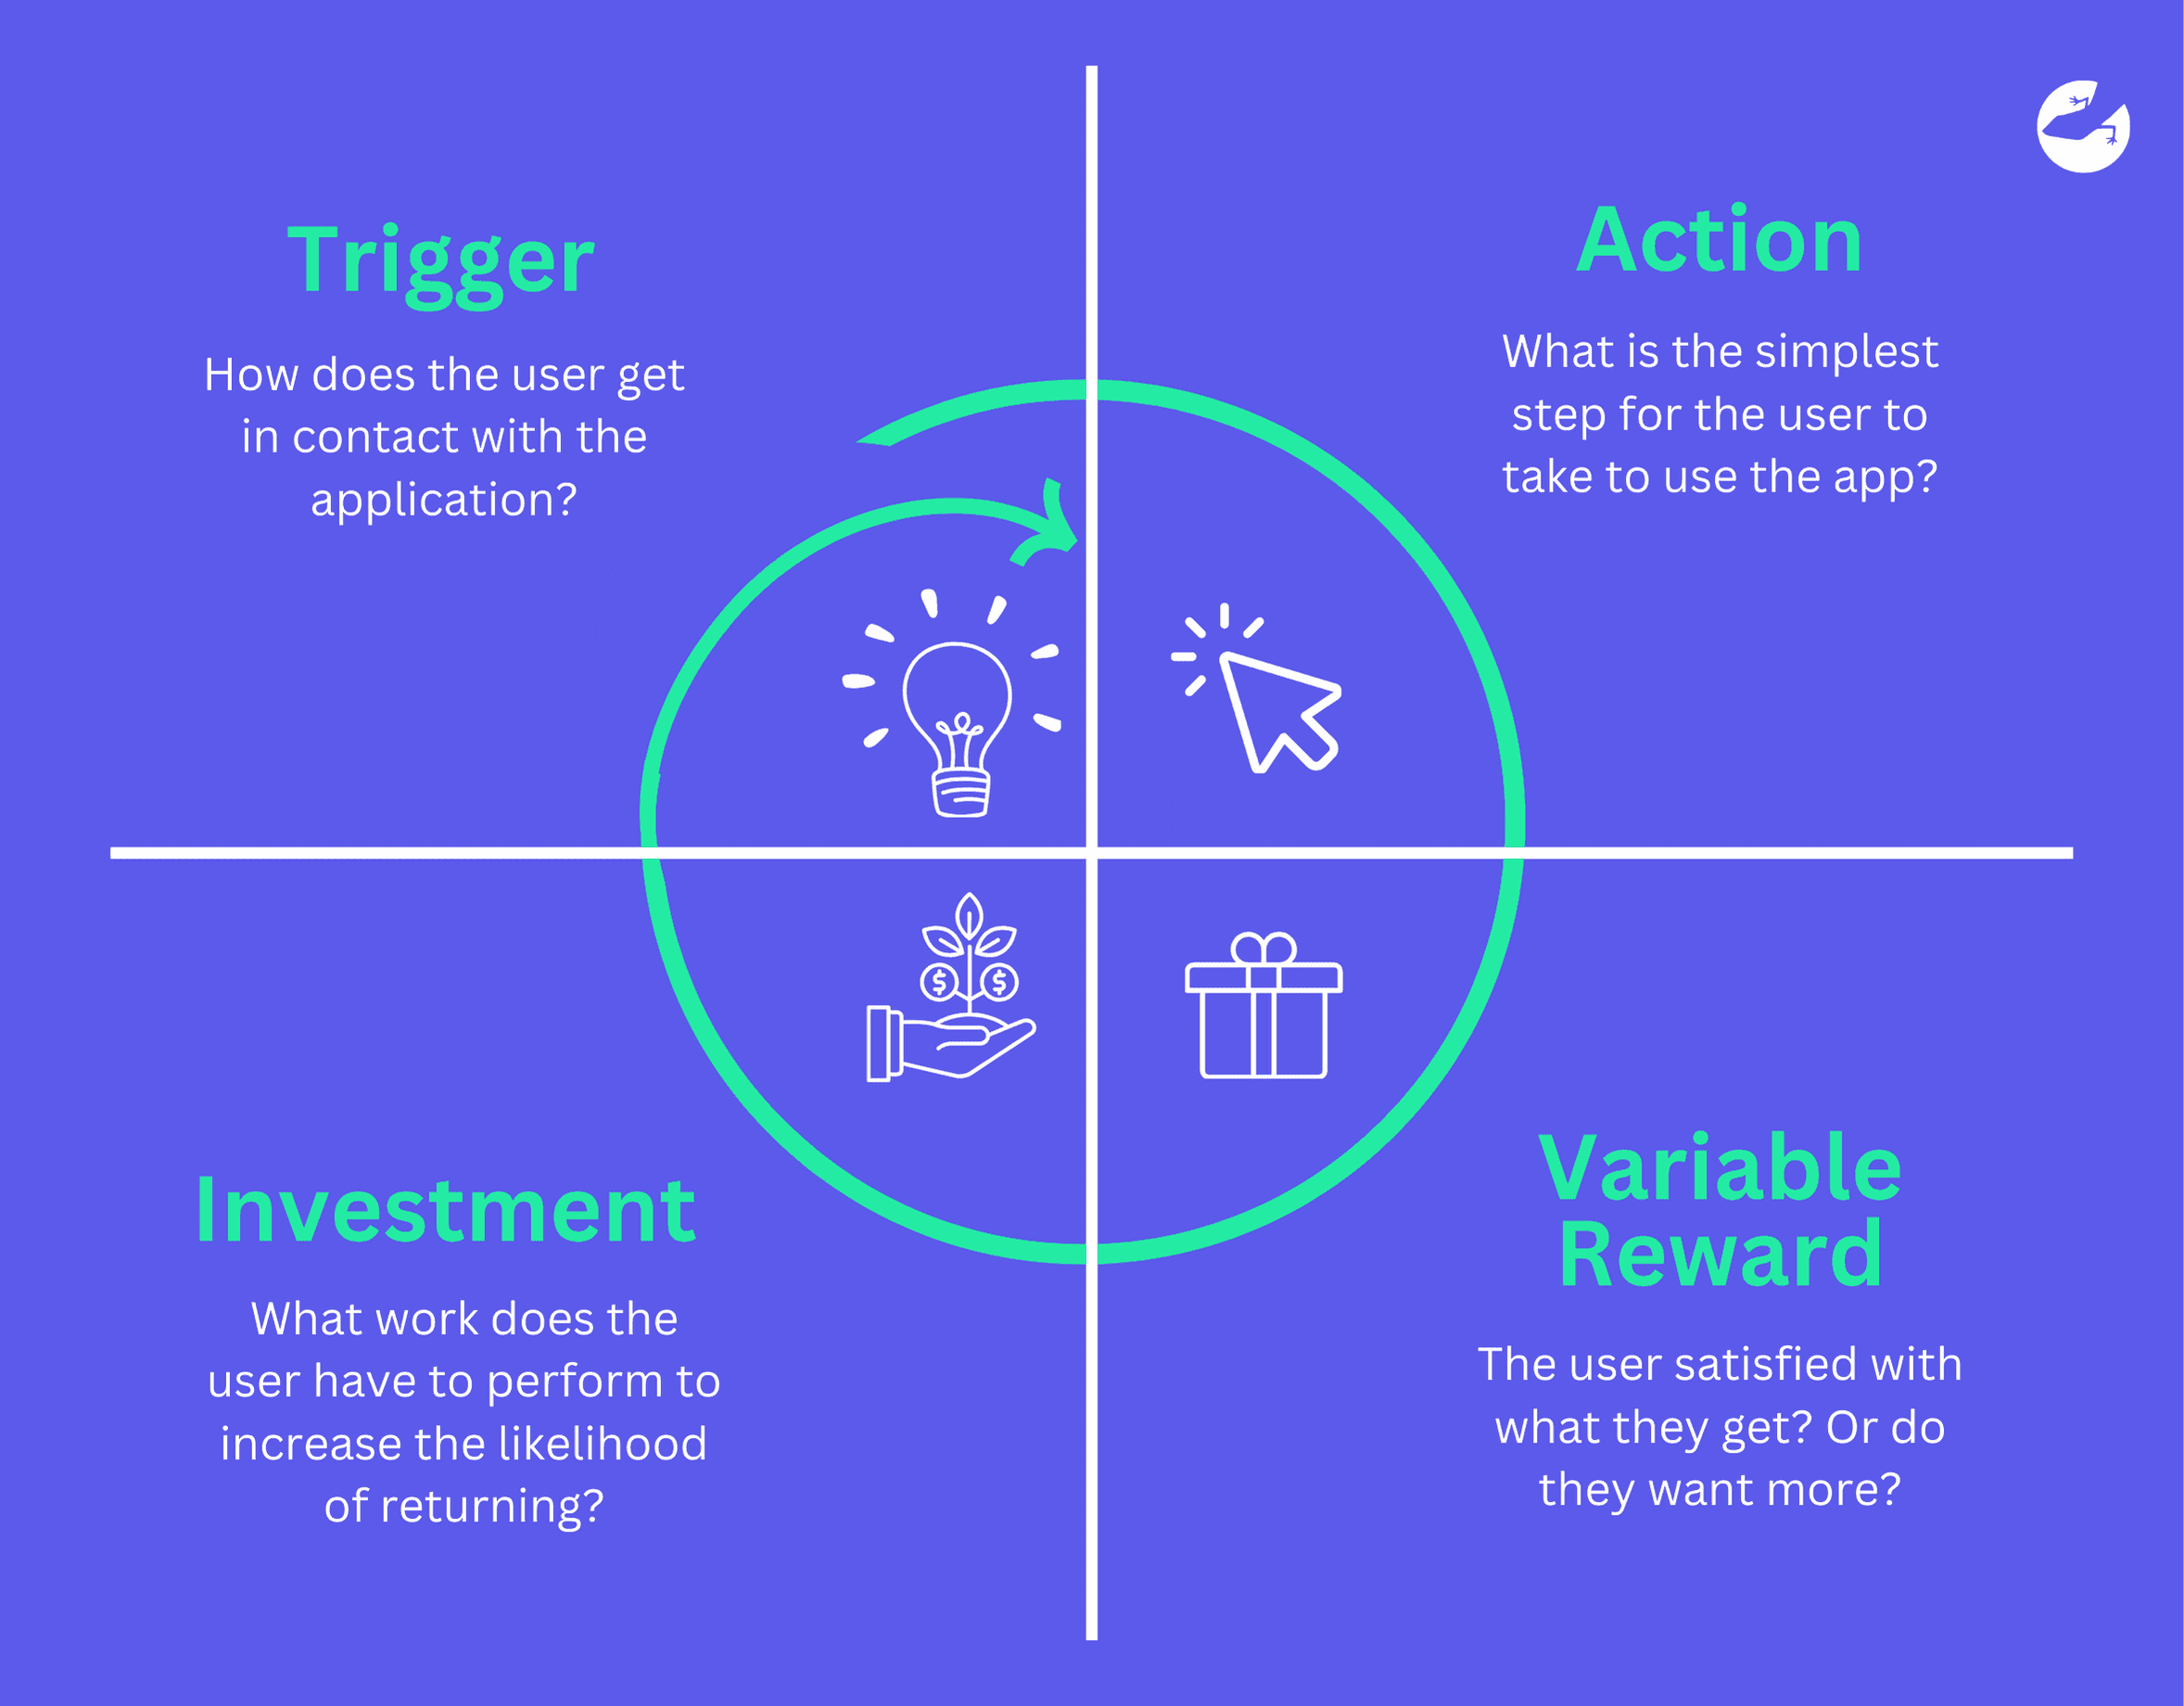
While the Hook Model isn't a measurement tool, it is closely correlated to lean analytics in its goals and applications. At Lizard Global, we use Lean Analytics by focusing on the “Hook Model”. The Hook Model is a four-phased process businesses can use to develop products that users will stick to. The ultimate goal is to achieve voluntary and high-frequency engagement, by creating an app users will embrace in their daily lives. Basically, the Hook Model is all about creating a customer habit.
The Hook Model consists of four phases:
Trigger: Typically, the trigger phase is the most important phase of the Hook Model. This is because first impressions are the most important to get users to keep coming back to the platform and better understand the value your app provides.
Triggers can be divided into 2 categories - internal and external triggers. Internal triggers are the emotional states or thought processes that get users to take action, for example they’re feeling bored or lonely. External triggers are the environmental prompts that encourage users to take actions like getting notifications or emails.
Action: This is where users take action with the anticipation of a reward. There needs to be a great motivating force for the action to occur. That’s why most apps have a very engaging and easy to use UI/UX.
Variable Reward: Reward given must be different to keep users engaged as the uncertainty and variability of the reward piques their interest and gets them coming back for more.
There are three types of variable rewards:
- Rewards of the Tribe: These are social rewards such as likes, comments etc.
- Rewards of the Hunt: Are material resources or information for example points, prizes etc.
- Rewards of the Self: This is personal satisfaction or mastery like completing a level in a game.
Investment: Think of this as “what work does the user have to perform to increase their likelihood of return". It creates a sense of ownership and some sort of an attachment to the product. Here is where users put in their time, data and even money which guarantees their return.
A/B Testing
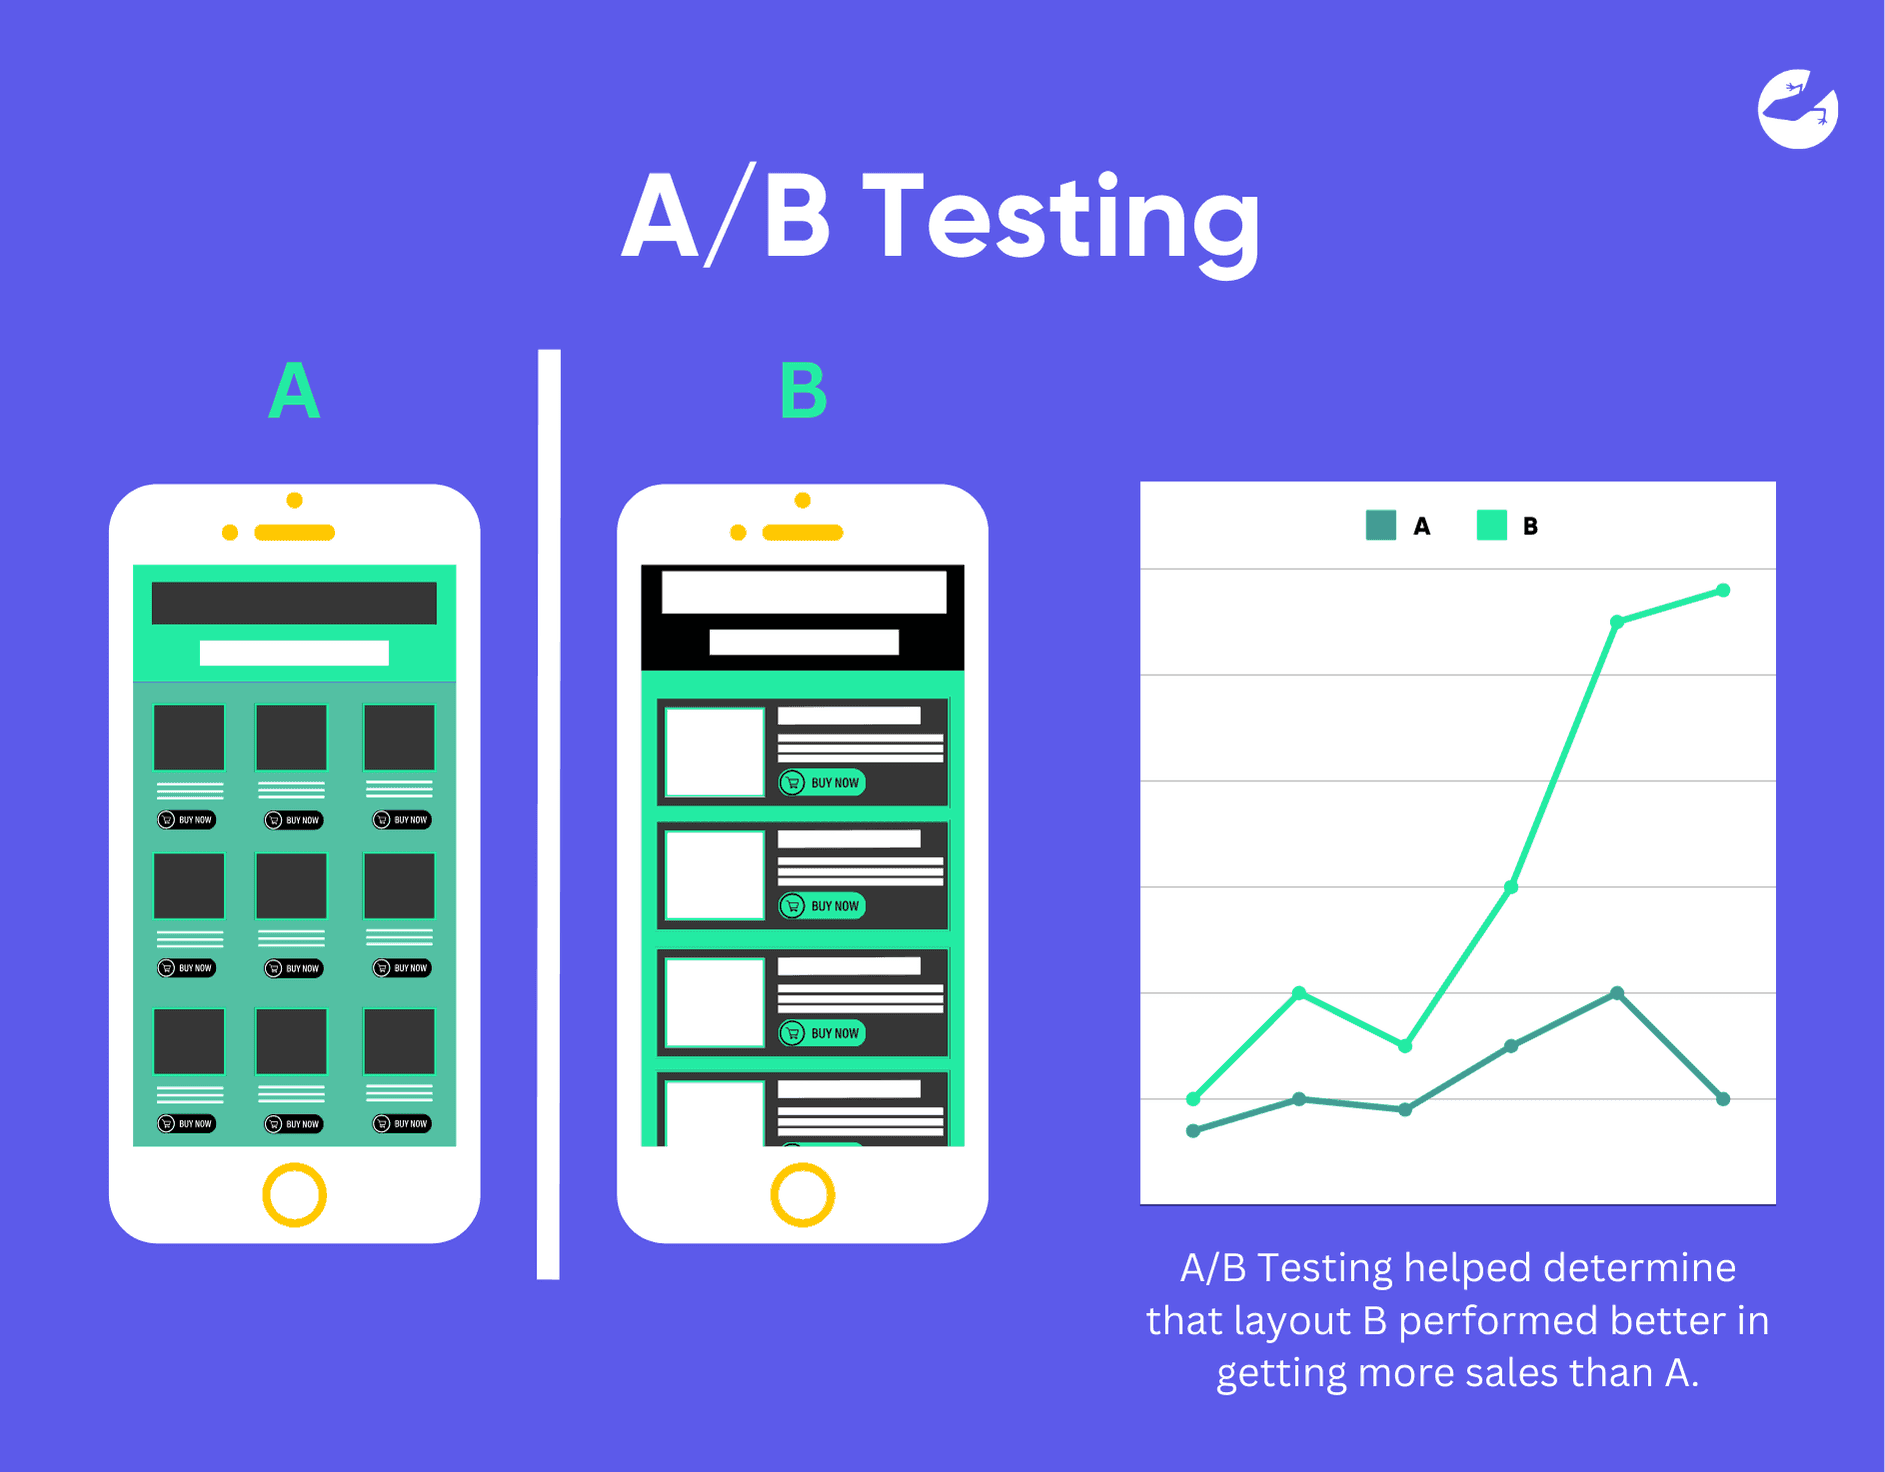
This was briefly mentioned previously to demonstrate how lean analytics helps in improving the process of decision-making. A/B testing is when two versions of the same product or service like a web page or app to determine which one performs better based on a specific metric like click-through rate or conversion rate. It helps make the best decisions tailored to optimizing the user experience and improving the key metrics to determine which yields the best results.
Funnel Analysis
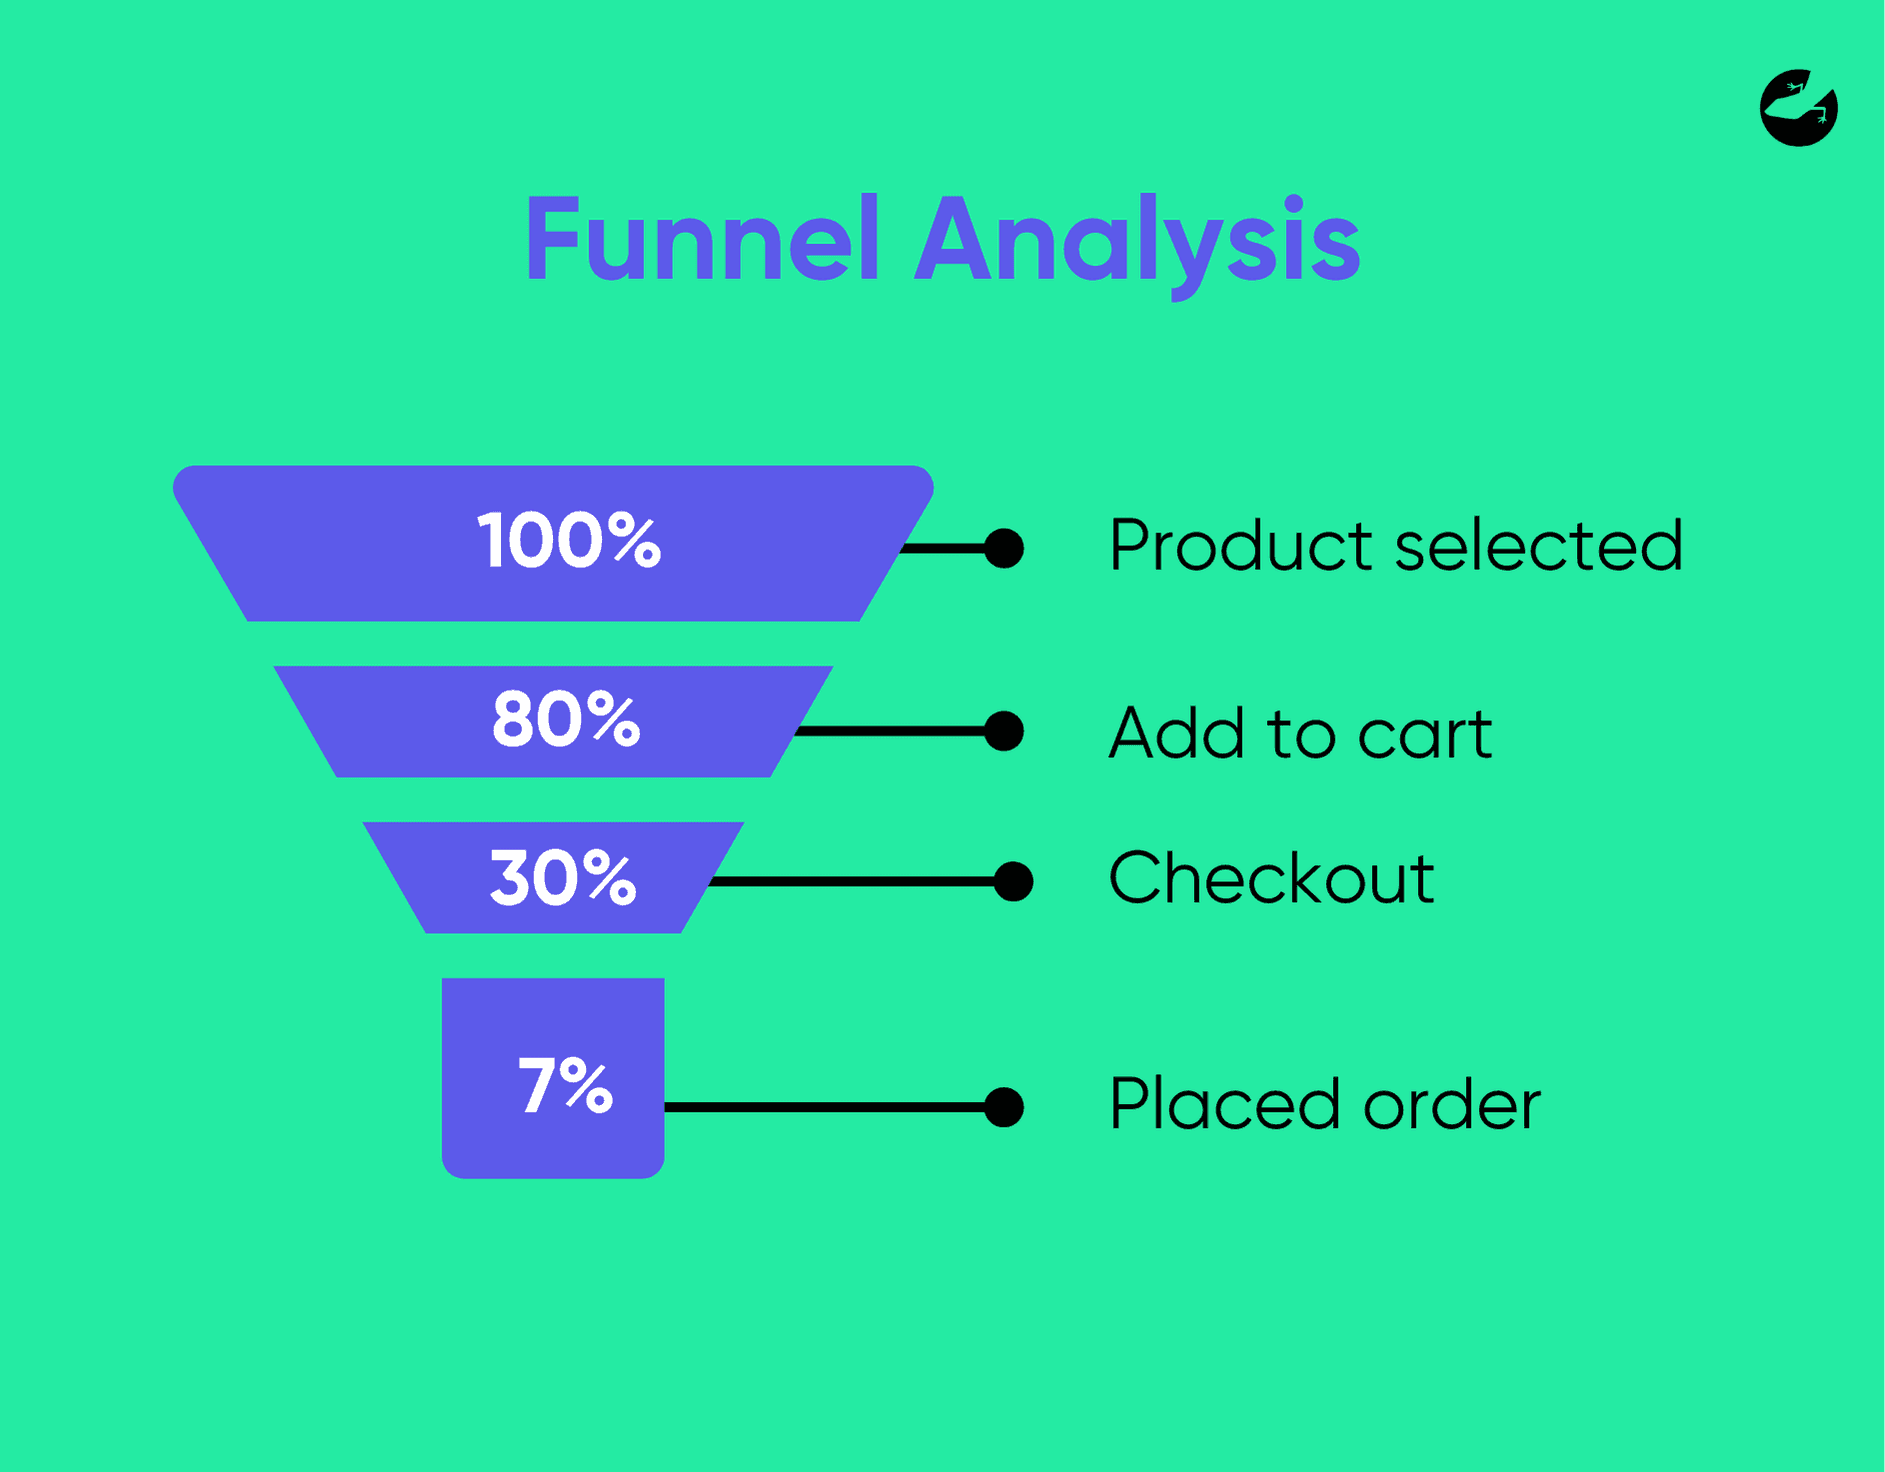
The funnel analysis is a great tool in lean analytics as it allows for the tracking of the steps users take to complete their action and also shows where they drop off. A couple of examples are making a purchase or signing up for a newsletter. You will be able to see the steps like “select product → add to cart → checkout → make payment → submitted”. It is very useful because it allows you to identify if there are any issues along the user journey and you will be able to correct it immediately helping optimize the conversion process.
Join 2000+ subscribers
Stay in the loop with everything you need to know
Key Performance Indicators (KPIs)
KPIs are pretty universal. It is a specified, measurable value that is an indication of the effectiveness of a company in achieving its business objectives. It is a great way to track progress, and helps ensure efforts are aligned with business priorities.
Cohort Analysis
Cohort analysis is when users are grouped based on their shared characteristics or experiences for a set duration to analyze their behavior over time. This is useful when it comes to understanding user retention and engagement as this analysis allows for a proper tracking of how different cohorts behave after their first interaction with the product.
How do we apply Lean Analytics?
Generally, Lean Analytics is about measuring progress through the “build-measure-learn” feedback loop created for validated learning. The questions we focus on using Lean Analytics are the following:
- What should we measure?
- How should we measure it?
- Why does it matter?
Lean Analytics focuses on 5 fundamental stages businesses can use to frame and aim their KPIs. Following these five elements, we can easily collect and analyze the relevant data, keep track of the success of our growth strategies, and immediately adapt where needed.
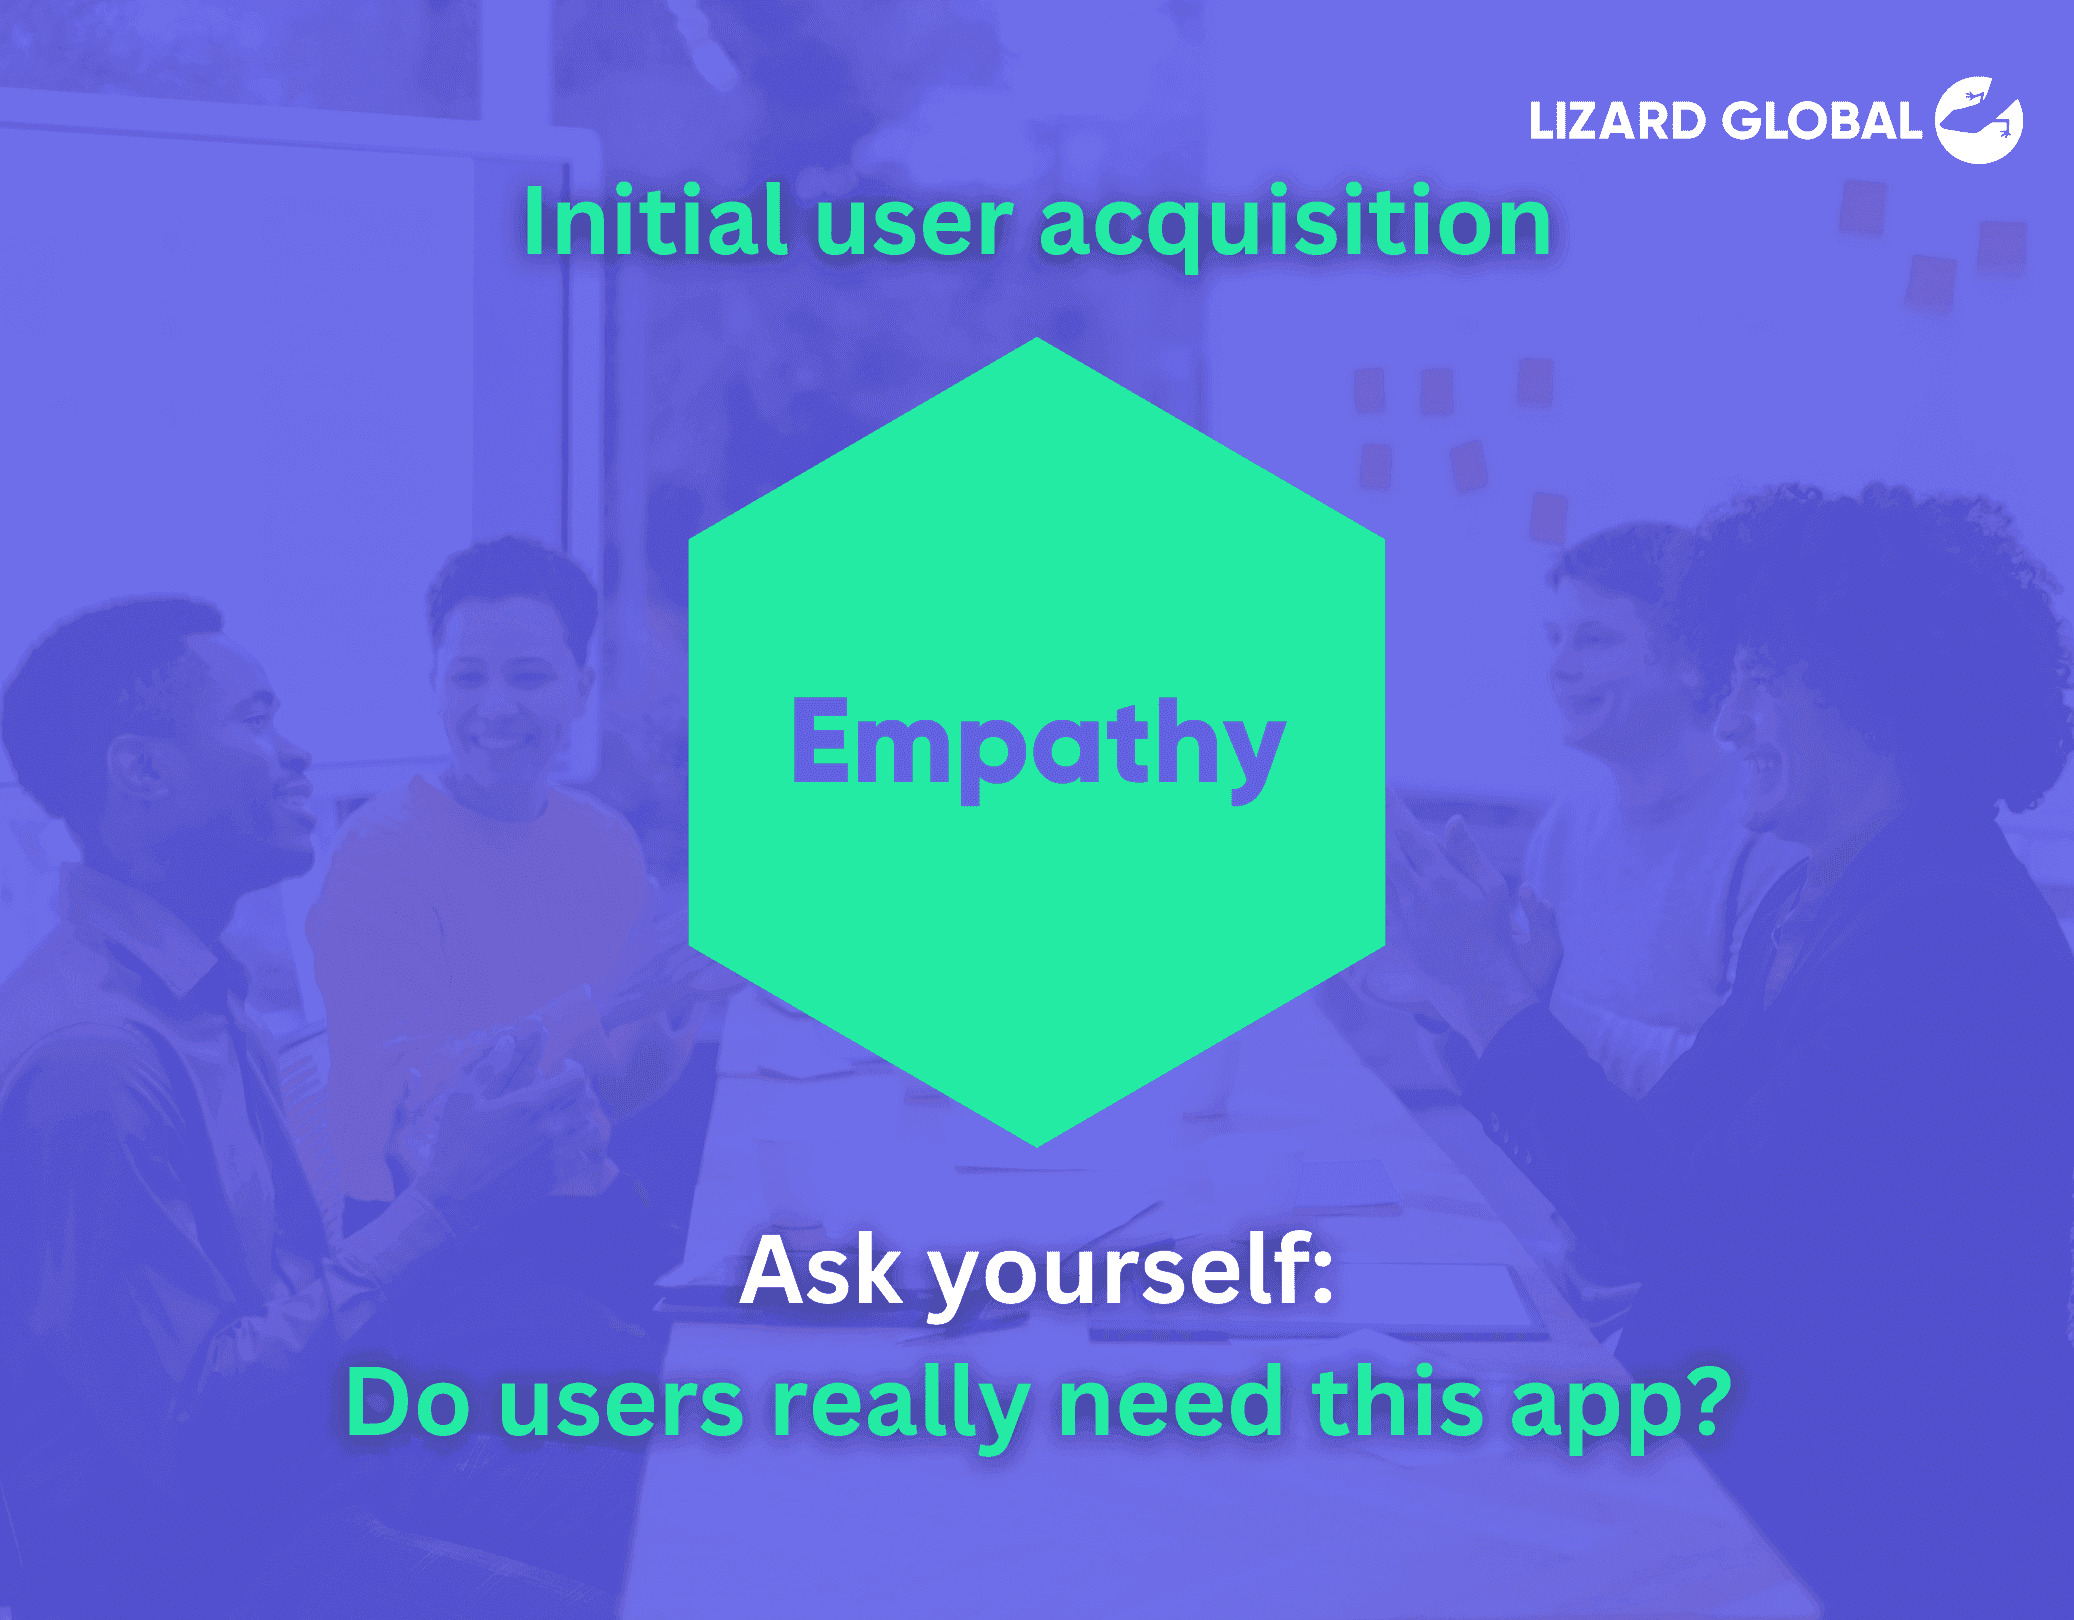
- Empathy: By identifying the problem that needs to be solved, we can address the most difficult question of all three: Why does it matter? Or, will anyone care? Following the principles of design thinking, we dive into the needs of the end-user and identify why they need that specific digital solution for their problem.
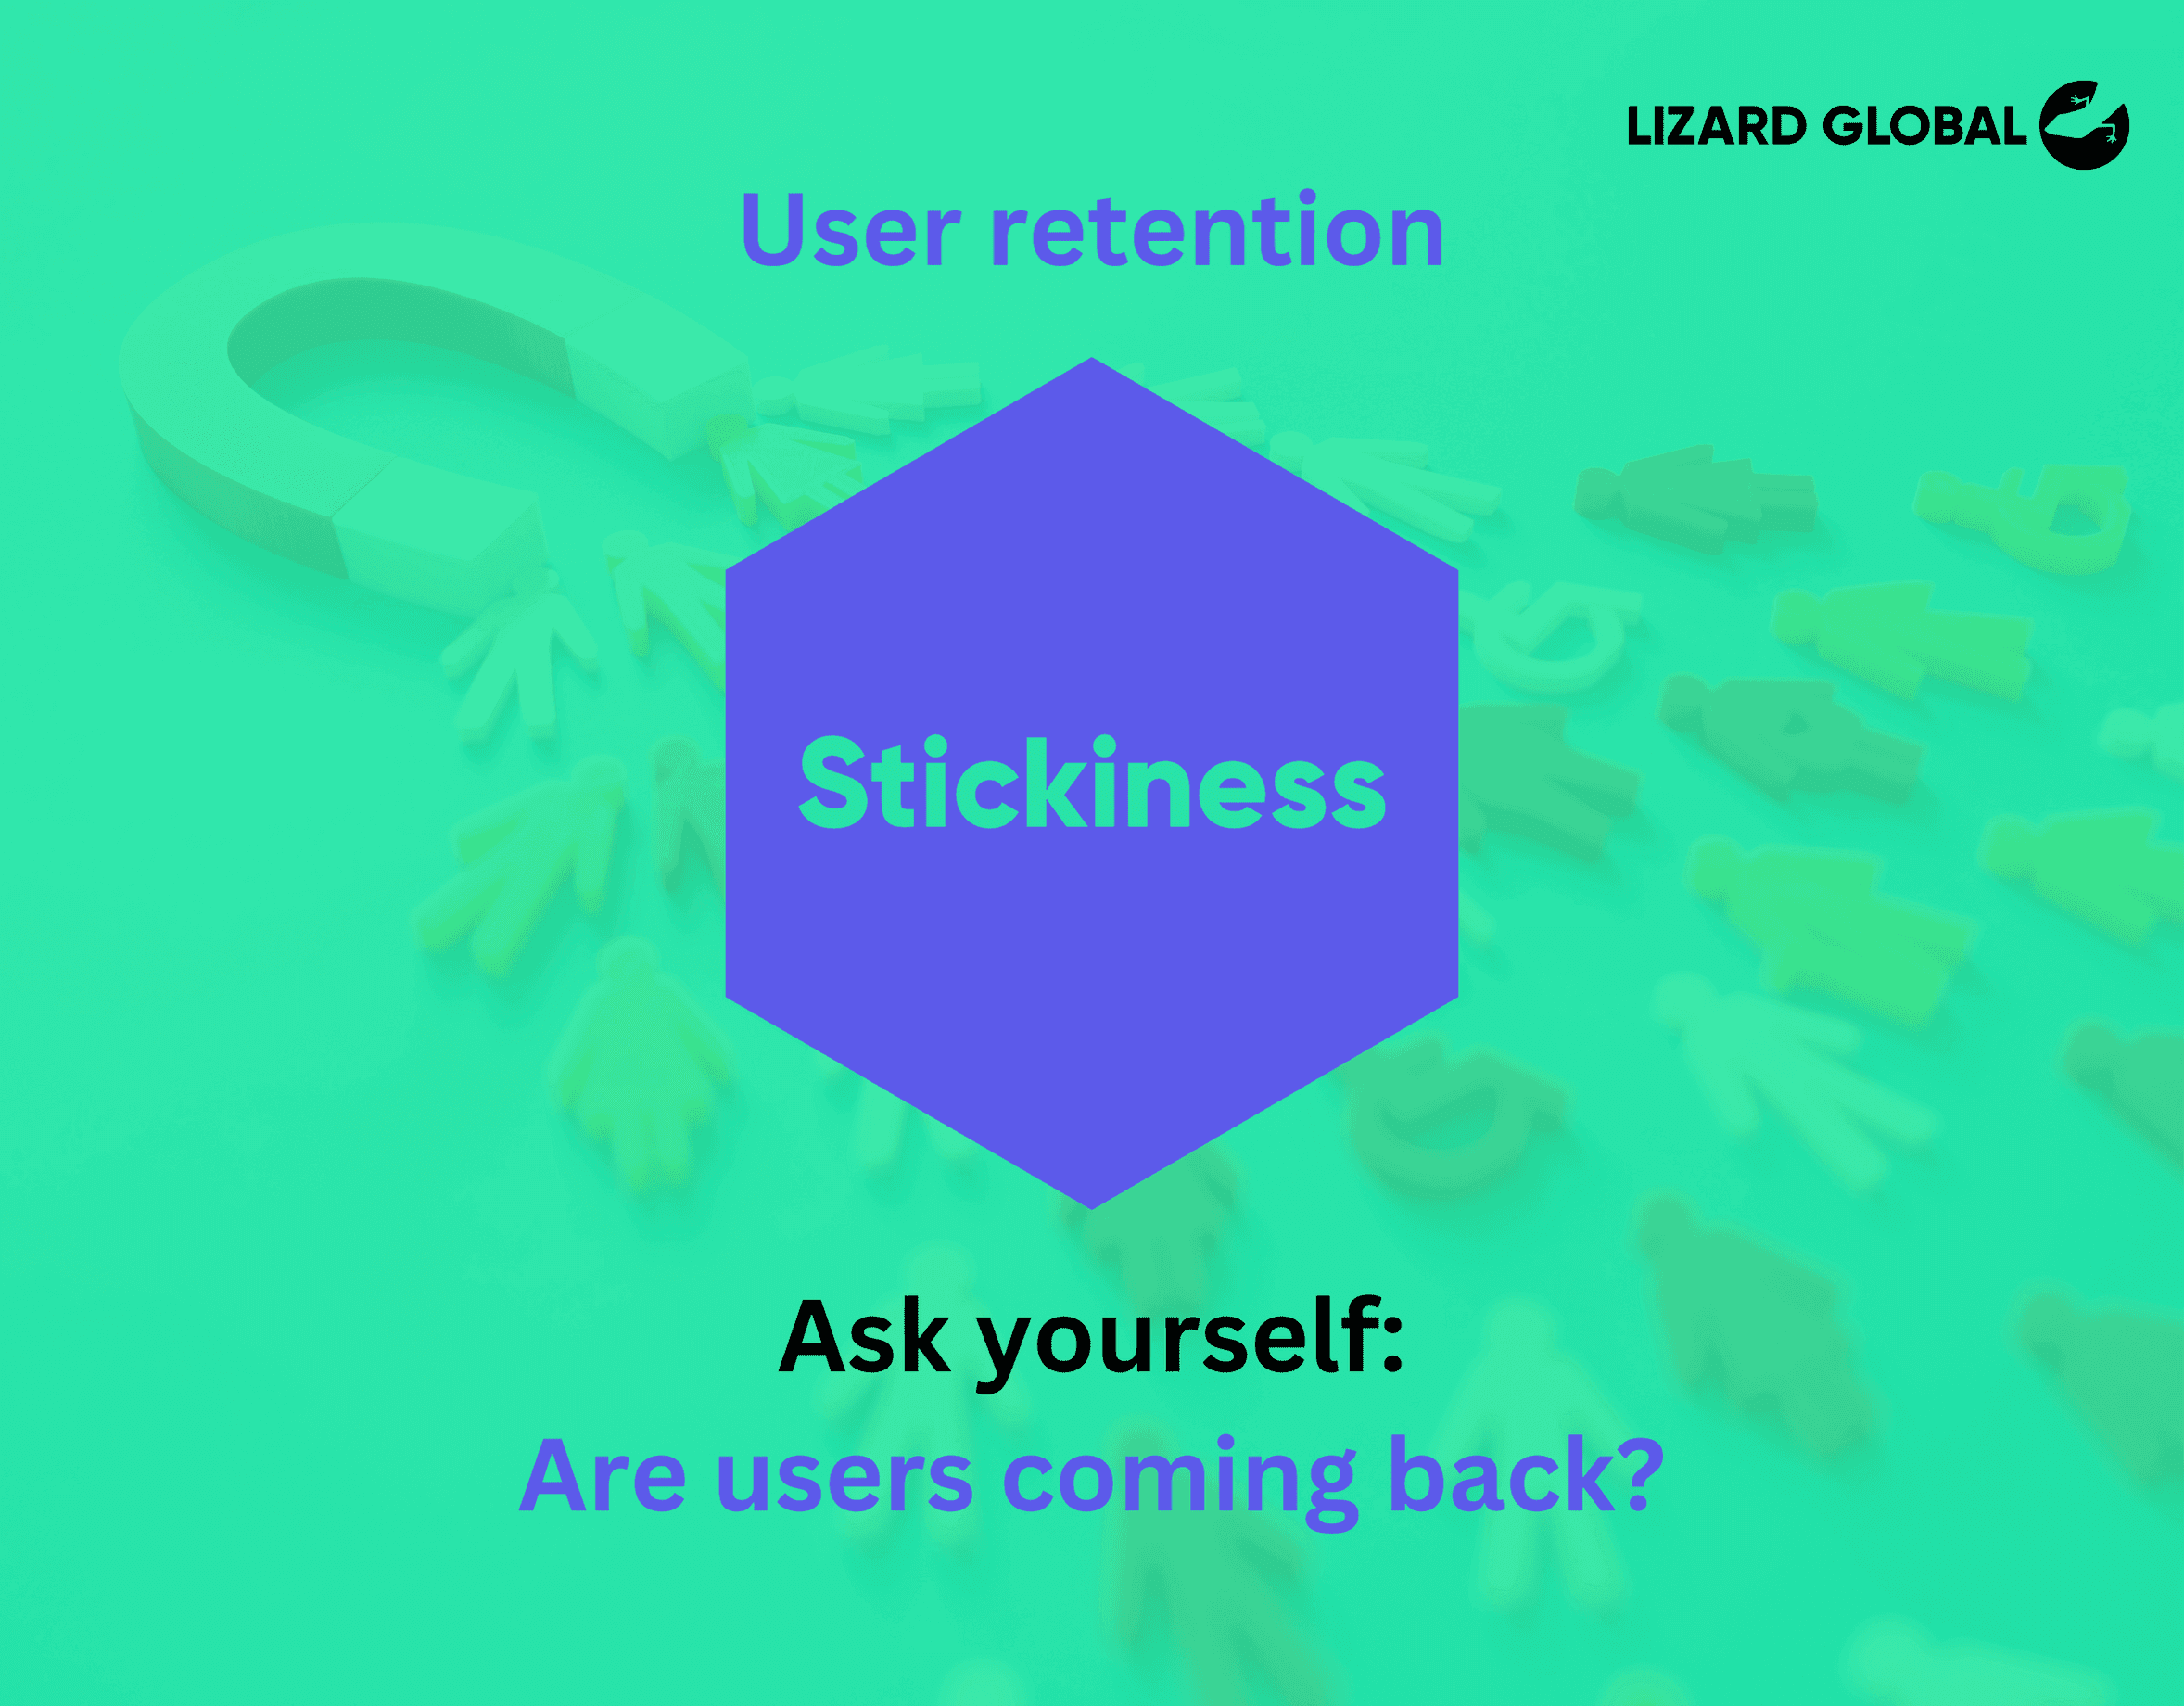
- Stickiness: One of the most difficult parts of turning an app into a success is customer retention. This stage focuses on the question: are users coming back to your product? In other words, how do we get people hooked?
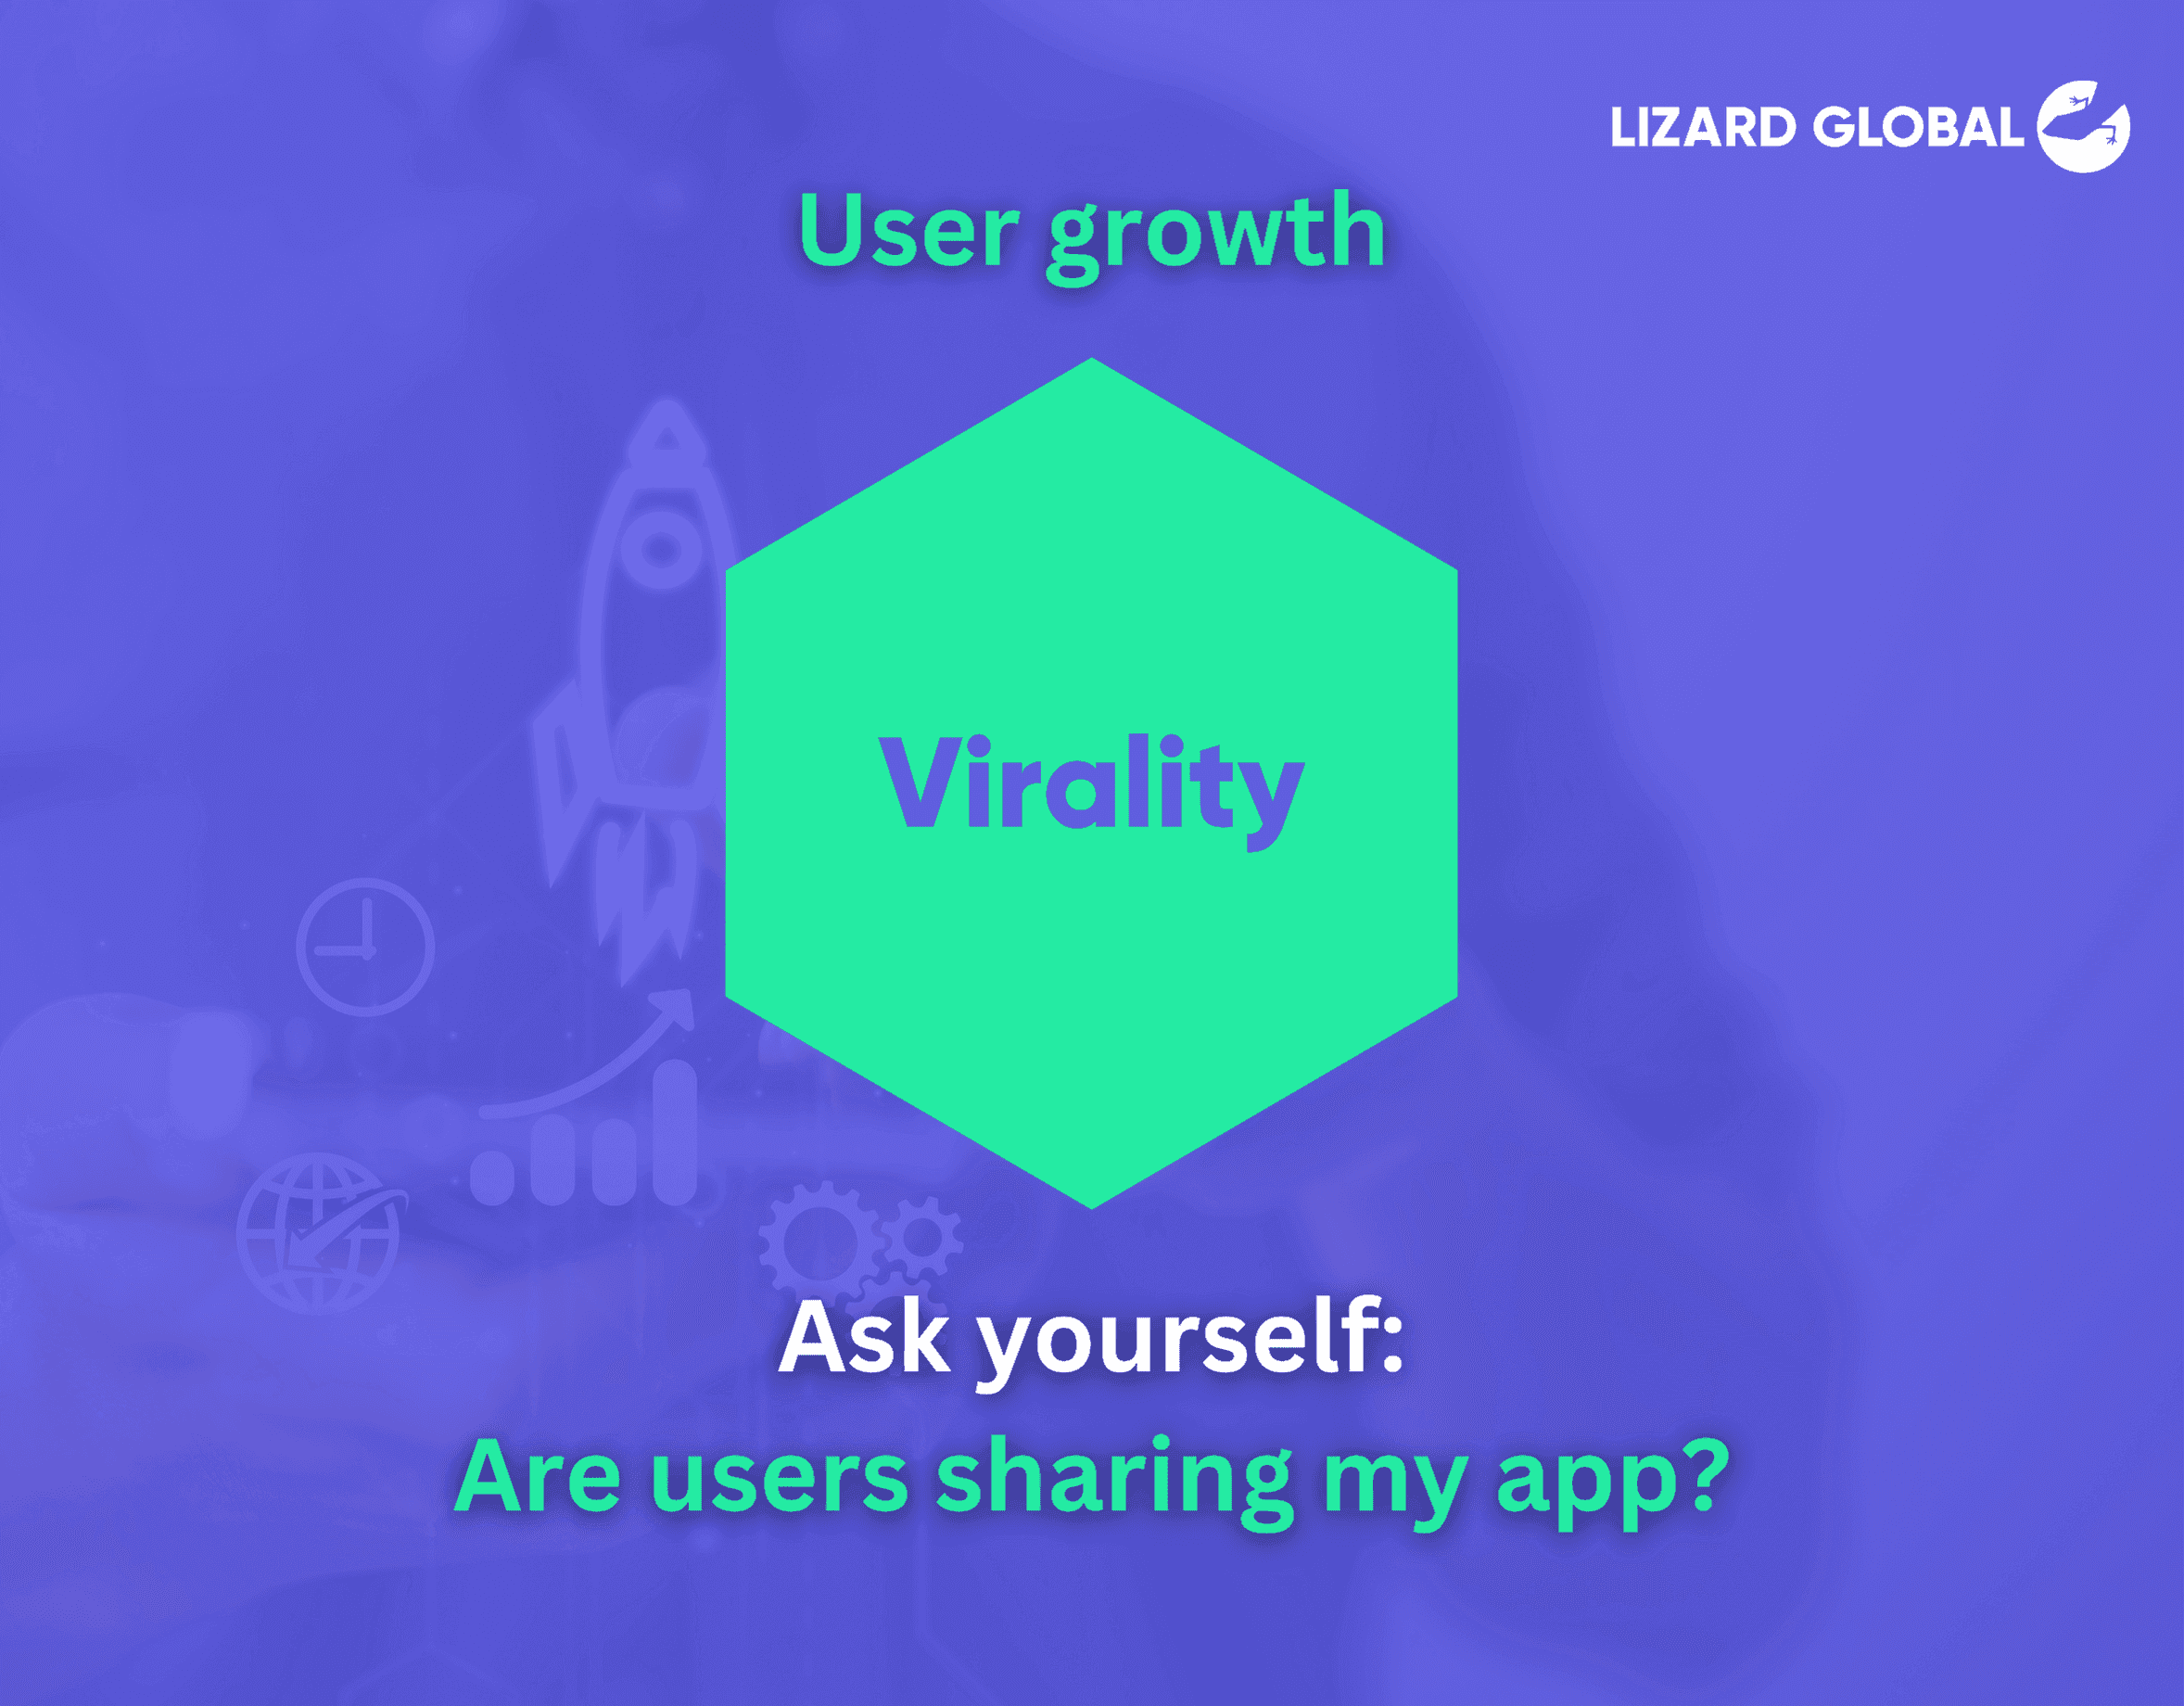
- Virality: This stage is all about the way your product gets advertised to the outside world. Once your product is there and a few users are using it on a regular basis, your added value has been validated and your solution is ready to be taken to a next level. This is where you try to get as many users to your platform as possible. It’s time to ask the following question: Are customers sharing my product or service with others? What can I do to stimulate this?
- Revenue: After you have gone viral and your USPs have been confirmed by the greater mass, you are ready to monetize your solution. At this point, you need to get results from your hard work: you need to create revenue. At this stage you need to ask yourself: who your potential customers are, what you can sell to them, and how you can track your revenue success.
- Scalability: After successfully monetizing your product, its lifecycle hasn’t ended yet. You can research the possibilities to scale up your business by diversifying geographically, or looking for additional industries your app could contribute to. This will enable your business to keep a sustainable and constant growth.
How can we help you?
At Lizard Global, we are specialized in growth and innovation, and Lean Analytics forms an indispensable part of our business model. Our experience in helping our clients conceptualizing and developing digital solutions allows us to sense exactly what your product needs in order to grow in a paced and sustainable way. Our team knows how to ask the right questions at the right moment, and focus on what’s really important using the OMTM methodology.
Want to know more about what we can do for the development and successful growth of your application? Drop us a line and we tell you all about Lean Analytics and how we can help you focus on the unique character and challenges of your business.
What Is Lean Analytics, Its Benefits & How To Implement It?
In this blog we dive into the topic of Lean Analytics. We share with you, what it is, what are its benefits, and how you can implement it.
If you’ve been reading through some of our blogs, you’ve probably come across the term Lean Startup, that describes the term as an agile approach for structuring the progress of your business and continuously adapting strategies where needed. The Lean Startup approach forms one of the cornerstones of our business processes within Lizard Global.
In order to measure the actual progress of your business, you’ll need a solid methodology to work with and this is where Lean Analytics comes in. Before diving deep into how it is used and what are the tools for it, you must first understand what lean analytics is.
What is Lean Analytics?
‘Lean Analytics’ is a term coined by Benjamin Yoskovitz and Alistair Croll in their book of the same name, and can be defined as an extension of the Lean Startup approach. It is used to measure the growth and success of your business by analyzing the maturity phase of your product and the specific actions and metrics that drive the right kind of growth during that stage.
At Lizard Global, we use Lean Analytics to optimize our agile ways of working, and the overall growth of your business by leveraging off of data to make the best decisions. Building technology is just a first step. In order to turn your solution into a successful product, it’s crucial to set the right KPIs, which are going to be dependent on your target audience, the type of technology you have, and the current stage of your business. By carefully picking your KPIs and tracking them, you enable your business to measure its performance and instantly act upon your analyzed data.
What are the benefits of applying Lean Analytics?
There are numerous benefits of applying lean analytics. Having worked with lean analytics for years, the experts at Lizard Global have narrowed it down to 5 recurring benefits they’ve observed over the years.
Here are the 5 benefits of applying lean analytics:
Increases decision-making efficiency: Businesses are given the upper hand in improving their decision-making by focusing on data-driven insights.
A great example of this is the use of A/B testing to test out the best option for a call-to-action (CTA) button. Instead of relying only on intuition or looking at what competitors are doing, businesses are able to analyze their customer’s interaction with the different CTA buttons - version A vs version B. The data obtained here will enable businesses to determine which version resonated more with their customers then leading the business to implement it and in return garner more sales.
Enhances scalability: With lean analytics businesses are able to identify strategies that are scalable through data.
For example, a business’ experimentation with SaaS to determine which can be used to best attract retain customers. The business then creates a few types of subscription plan - free, monthly, and annually. Based on the data collected the business notices the higher retention and lower churn rate compared to the other two subscription plans. This enables the business to then focus on promoting their annual plan which aids in the scalability of their company.
Reduction in risk: Business risk is reduced through the possibility of making early and often assumptions that also helps avoid costly mistakes.
Take an e-commerce business making a hypothesis that there will be an increase in their sales if they offer free shipping. Before going full blast and implementing the free shipping they decide to run a limited-time free shipping promotion for selected products and they observe their sales data. The results indicate that there was not only an increase in sales for that particular product but also an increase in the order value. This gives them the information needed to then implement free shipping for all products, reducing their risk of loss from an untested assumption.
Ever wondered how an E-commerce business is started? Read our blog How Do You Start An Ecommerce Business In Malaysia?
Better customer focus: Businesses are able to remain aligned with their customer needs and behaviors through the data collected.
Let’s take a look at mobile app developers for this example where they conduct comprehensive analysis to better understand user behavior. With this analysis they discover that there is a significantly higher retention rate when customers complete the tutorial than those who don’t. The company then redesigns the onboarding process to ensure the tutorial is not only more engaging but also mandatory leading to an increase in their user retention.
Optimization of resources: Resources can be better allocated through focusing on the areas that are most impactful for the business.
A great example of this is, imagine a marketing team that has a limited budget to with but they want to maximize their return on investment (ROI). How do they do this? They start with tracking the performance of their marketing channels like their social media, paid search, email marketing etc. They find that out of all the areas they’ve focused on, the one that garners the most conversion rates and is at a cheaper cost is email marketing. This allows them to allocate more budget to their email marketing giving them an increase in profit without having to increase the cost for it.
Find out how you can improve your email marketing
Tools In Lean Analytics
The One Metrics That Matters (OMTM)
The most essential tool we use during the process of Lean Analytics is the One Metrics That Matters (OMTM), which we apply to help determine the right KPIs tailored to your solution and pinned objectives.
It’s all about finding the right thing to track at the right time, based on factors such as the current state of your business, type of business, and the industry you’re active in. The OMTM supports us to create and encourage focus and keeps our team on track regarding measuring growth and success.
An example of OMTM for mobile apps will be the Daily Active Users (DAU), the reason this is the focus area is because a high user engagement is crucial to an app’s success. With this success the app then has the ability to increase its revenue with opportunities in adding ads or in-app purchases.
Want to find out how much it costs to build your dream app or web app?
The Hook Model
While the Hook Model isn't a measurement tool, it is closely correlated to lean analytics in its goals and applications. At Lizard Global, we use Lean Analytics by focusing on the “Hook Model”. The Hook Model is a four-phased process businesses can use to develop products that users will stick to. The ultimate goal is to achieve voluntary and high-frequency engagement, by creating an app users will embrace in their daily lives. Basically, the Hook Model is all about creating a customer habit.
The Hook Model consists of four phases:
Trigger: Typically, the trigger phase is the most important phase of the Hook Model. This is because first impressions are the most important to get users to keep coming back to the platform and better understand the value your app provides.
Triggers can be divided into 2 categories - internal and external triggers. Internal triggers are the emotional states or thought processes that get users to take action, for example they’re feeling bored or lonely. External triggers are the environmental prompts that encourage users to take actions like getting notifications or emails.
Action: This is where users take action with the anticipation of a reward. There needs to be a great motivating force for the action to occur. That’s why most apps have a very engaging and easy to use UI/UX.
Variable Reward: Reward given must be different to keep users engaged as the uncertainty and variability of the reward piques their interest and gets them coming back for more.
There are three types of variable rewards:
- Rewards of the Tribe: These are social rewards such as likes, comments etc.
- Rewards of the Hunt: Are material resources or information for example points, prizes etc.
- Rewards of the Self: This is personal satisfaction or mastery like completing a level in a game.
Investment: Think of this as “what work does the user have to perform to increase their likelihood of return". It creates a sense of ownership and some sort of an attachment to the product. Here is where users put in their time, data and even money which guarantees their return.
A/B Testing
This was briefly mentioned previously to demonstrate how lean analytics helps in improving the process of decision-making. A/B testing is when two versions of the same product or service like a web page or app to determine which one performs better based on a specific metric like click-through rate or conversion rate. It helps make the best decisions tailored to optimizing the user experience and improving the key metrics to determine which yields the best results.
Funnel Analysis
The funnel analysis is a great tool in lean analytics as it allows for the tracking of the steps users take to complete their action and also shows where they drop off. A couple of examples are making a purchase or signing up for a newsletter. You will be able to see the steps like “select product → add to cart → checkout → make payment → submitted”. It is very useful because it allows you to identify if there are any issues along the user journey and you will be able to correct it immediately helping optimize the conversion process.
Join 2000+ subscribers
Stay in the loop with everything you need to know
Key Performance Indicators (KPIs)
KPIs are pretty universal. It is a specified, measurable value that is an indication of the effectiveness of a company in achieving its business objectives. It is a great way to track progress, and helps ensure efforts are aligned with business priorities.
Cohort Analysis
Cohort analysis is when users are grouped based on their shared characteristics or experiences for a set duration to analyze their behavior over time. This is useful when it comes to understanding user retention and engagement as this analysis allows for a proper tracking of how different cohorts behave after their first interaction with the product.
How do we apply Lean Analytics?
Generally, Lean Analytics is about measuring progress through the “build-measure-learn” feedback loop created for validated learning. The questions we focus on using Lean Analytics are the following:
- What should we measure?
- How should we measure it?
- Why does it matter?
Lean Analytics focuses on 5 fundamental stages businesses can use to frame and aim their KPIs. Following these five elements, we can easily collect and analyze the relevant data, keep track of the success of our growth strategies, and immediately adapt where needed.
- Empathy: By identifying the problem that needs to be solved, we can address the most difficult question of all three: Why does it matter? Or, will anyone care? Following the principles of design thinking, we dive into the needs of the end-user and identify why they need that specific digital solution for their problem.
- Stickiness: One of the most difficult parts of turning an app into a success is customer retention. This stage focuses on the question: are users coming back to your product? In other words, how do we get people hooked?
- Virality: This stage is all about the way your product gets advertised to the outside world. Once your product is there and a few users are using it on a regular basis, your added value has been validated and your solution is ready to be taken to a next level. This is where you try to get as many users to your platform as possible. It’s time to ask the following question: Are customers sharing my product or service with others? What can I do to stimulate this?
- Revenue: After you have gone viral and your USPs have been confirmed by the greater mass, you are ready to monetize your solution. At this point, you need to get results from your hard work: you need to create revenue. At this stage you need to ask yourself: who your potential customers are, what you can sell to them, and how you can track your revenue success.
- Scalability: After successfully monetizing your product, its lifecycle hasn’t ended yet. You can research the possibilities to scale up your business by diversifying geographically, or looking for additional industries your app could contribute to. This will enable your business to keep a sustainable and constant growth.
How can we help you?
At Lizard Global, we are specialized in growth and innovation, and Lean Analytics forms an indispensable part of our business model. Our experience in helping our clients conceptualizing and developing digital solutions allows us to sense exactly what your product needs in order to grow in a paced and sustainable way. Our team knows how to ask the right questions at the right moment, and focus on what’s really important using the OMTM methodology.
Want to know more about what we can do for the development and successful growth of your application? Drop us a line and we tell you all about Lean Analytics and how we can help you focus on the unique character and challenges of your business.
FAQs
How does Lean Analytics fit within the Lean Startup framework?
What is validated learning?
How do I choose my OMTM?
What are actionable metrics versus vanity metrics?
What other tools are commonly used in Lean Analytics?
How can I ensure my metrics are actionable?
What is the importance of customer-centricity in Lean Analytics?
How do I integrate qualitative and quantitative data in Lean Analytics?
Can Lean Analytics be applied to non-startup businesses?
similar reads

Agile Methodology
Lean Analytics
UI/UX & Product Design
Software Development
The Road Towards Successful User Story Mapping
21 February 2023

'UI/UX & Product Design
Company Culture & Milestones'
Rebranding Lizard Global: How a New Design Can Boost Your Brand
22 February 2023

Agile Methodology
Lean Analytics
How to Build a Killer Growth Hacking Team
22 February 2023
Stuck between a great idea and the right team to build it?Let's talk.
We work with corporate innovation teams and ambitious scale-ups across the Netherlands, Singapore, and Australia, and wherever great software needs to be built. Drop us a message and we'll get back to you within one business day.


Markus Monnikendam
Global Commercial Director
hello@lizard.global