UI/UX Data Analysis
McDonald’s
+ 1 more ...
How McDonald's Kiosks Use UI/UX Data Analysis to Boost Revenue Per Customer in 2024
27 May 2025
by Author - Jeremy Raes, CEO & Co-founder, Editor - Nadiy, Senior Content Writer
27 May 2025
by Author - Jeremy Raes, CEO & Co-founder, Editor - Nadiy, Senior Content Writer
UI/UX Data Analysis
McDonald’s
Customer Behavior
How McDonald's Kiosks Use UI/UX Data Analysis to Boost Revenue Per Customer in 2024
Table of contents
Contact us
We will get back to you in the next 48 hours.
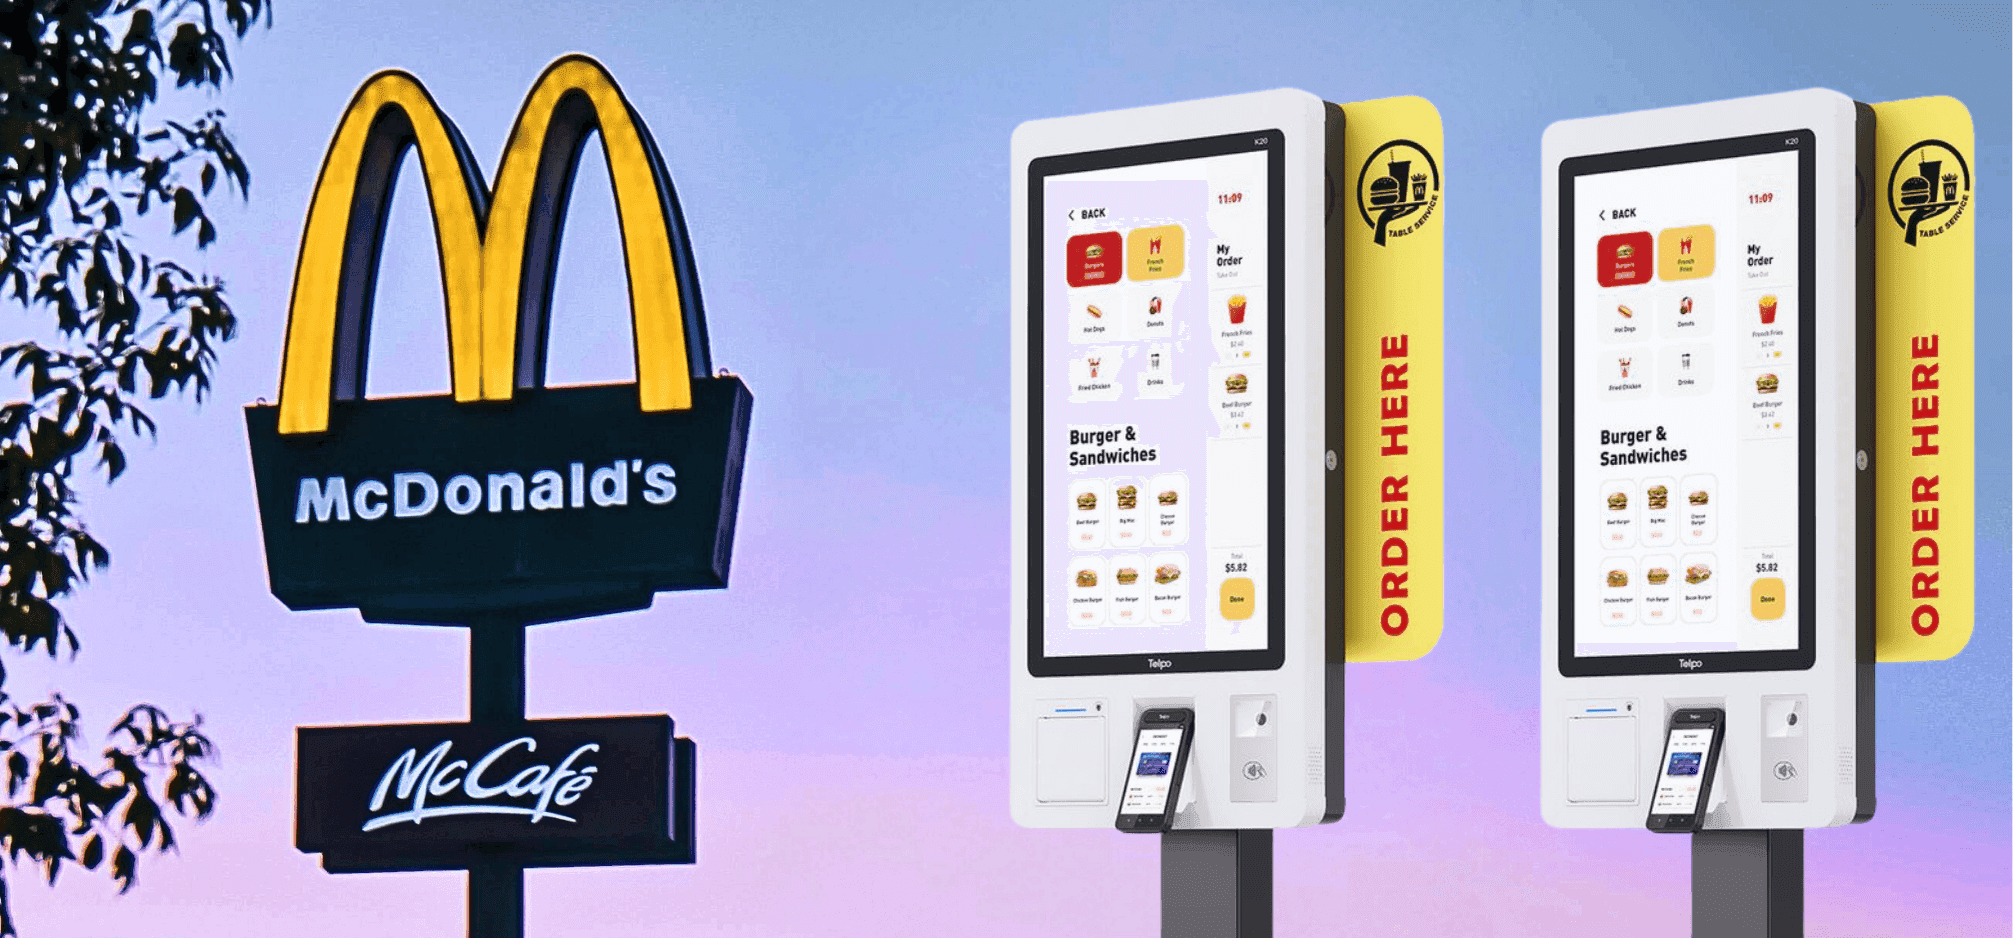
McDonald's is transforming the fast-food experience with intelligent UI/UX design and data-driven decision-making. This blog dives into how the brand leverages customer interaction data from digital kiosks to subtly increase order value—without feeling pushy. Learn how smart design choices are driving real business results.
key takeaways
Every time you tap a McDonald’s self-service kiosk, you’re likely spending 15-20% more than if you’d ordered at the counter. This isn’t by accident. Behind the touchscreen lies a masterclass in UI/UX psychology, data analytics, and conversion design all engineered to make you buy more.
Marketed as a convenience tool, the kiosk is actually McDonald’s most consistent upselling employee. And it never forgets its script.
Understanding UI/UX Data Analytics: The Foundation of Digital Experience Optimization
Before diving deeper into McDonald's strategy, let's clarify what UI/UX data analytics actually entails. UI/UX data analytics is the systematic collection, measurement, and analysis of user interactions with digital interfaces to improve user experience and drive business outcomes. It combines design principles with quantitative data to create interfaces that not only satisfy users but also achieve specific business goals.
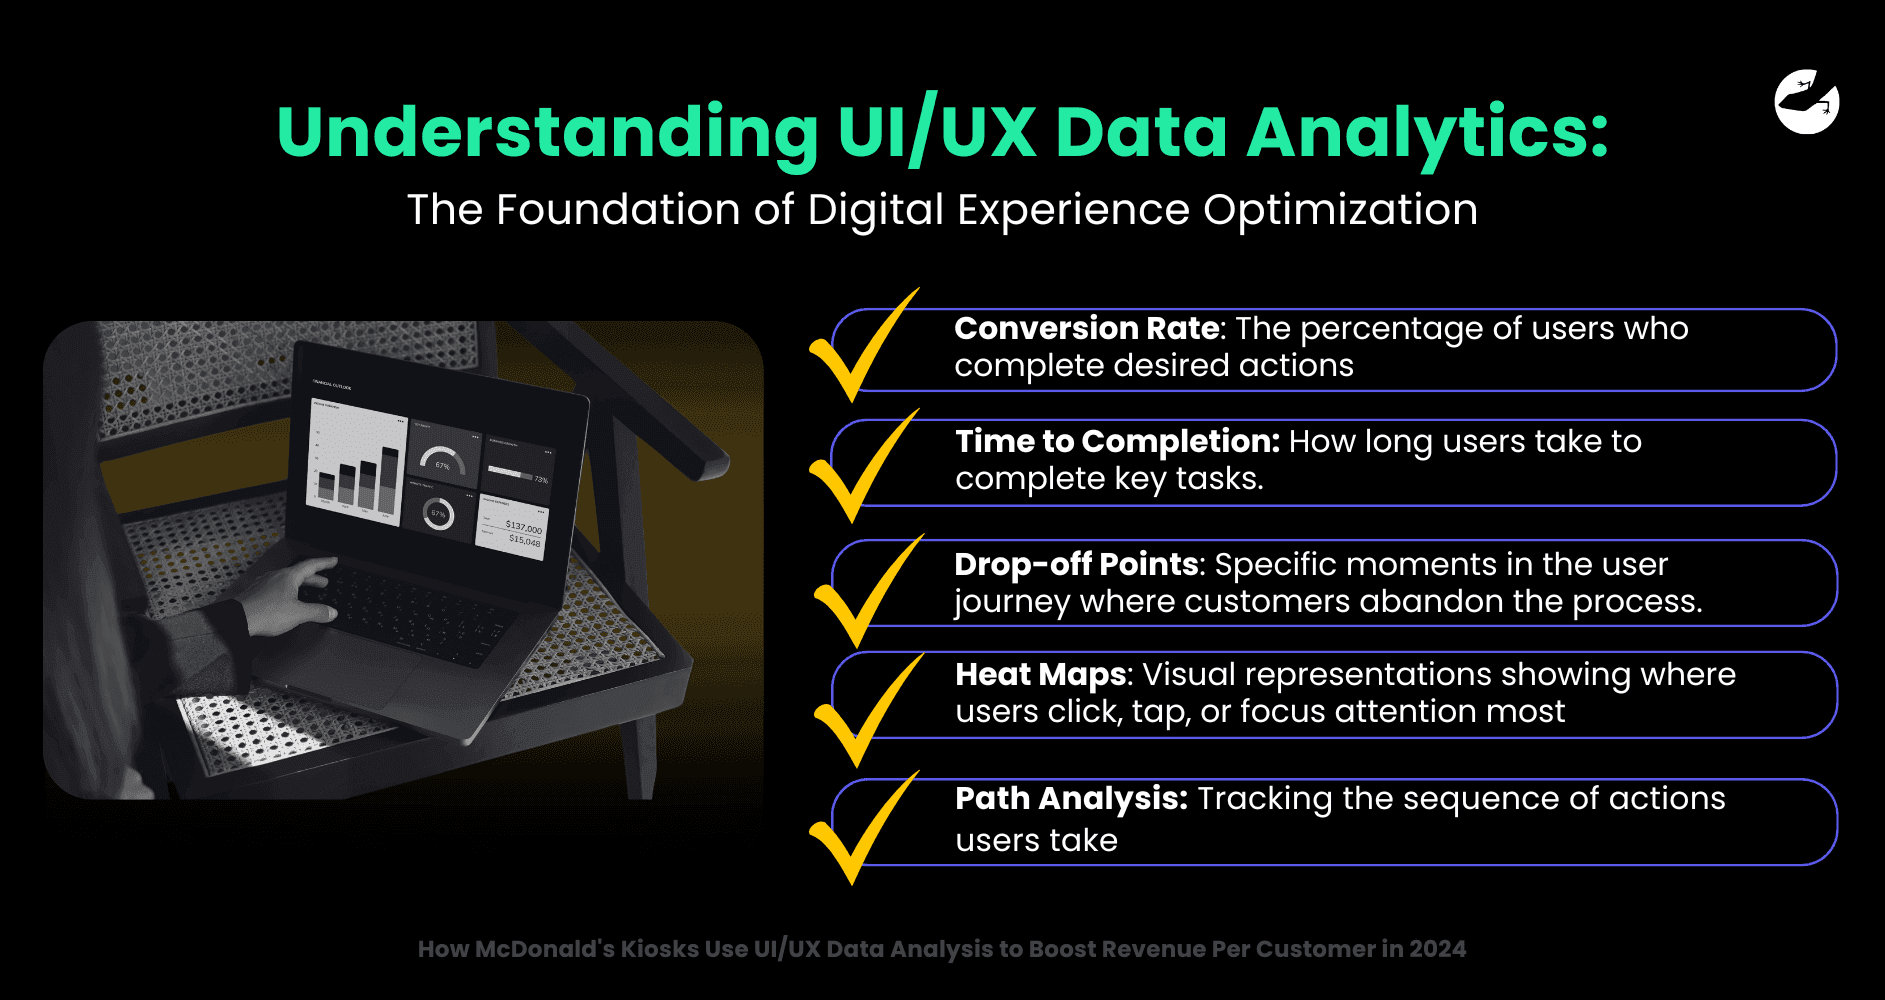
For businesses implementing UI/UX data analytics, several key metrics typically guide decision-making:
- Conversion Rate: The percentage of users who complete desired actions, such as adding items to cart or completing a purchase. For McDonald's kiosks, a critical conversion metric is the percentage of customers who accept upsell offers.
- Time to Completion: How long users take to complete key tasks. Efficient interfaces minimize unnecessary steps while maximizing value-adding interactions.
- Drop-off Points: Specific moments in the user journey where customers abandon the process. These identify friction points that need redesign.
- Heat Maps: Visual representations showing where users click, tap, or focus attention most frequently, guiding optimal placement of high-value elements.
- Path Analysis: Tracking the sequence of actions users take, revealing natural user flows that can be optimized for business objectives.
By tracking these metrics and continuously testing interface changes, companies can create digital experiences that feel intuitive to users while systematically guiding them toward actions that benefit the business. McDonald's success with kiosks demonstrates how powerful this approach can be when implemented at scale.
How McDonald’s Uses UI/UX Data Analytics to Increase Order Value
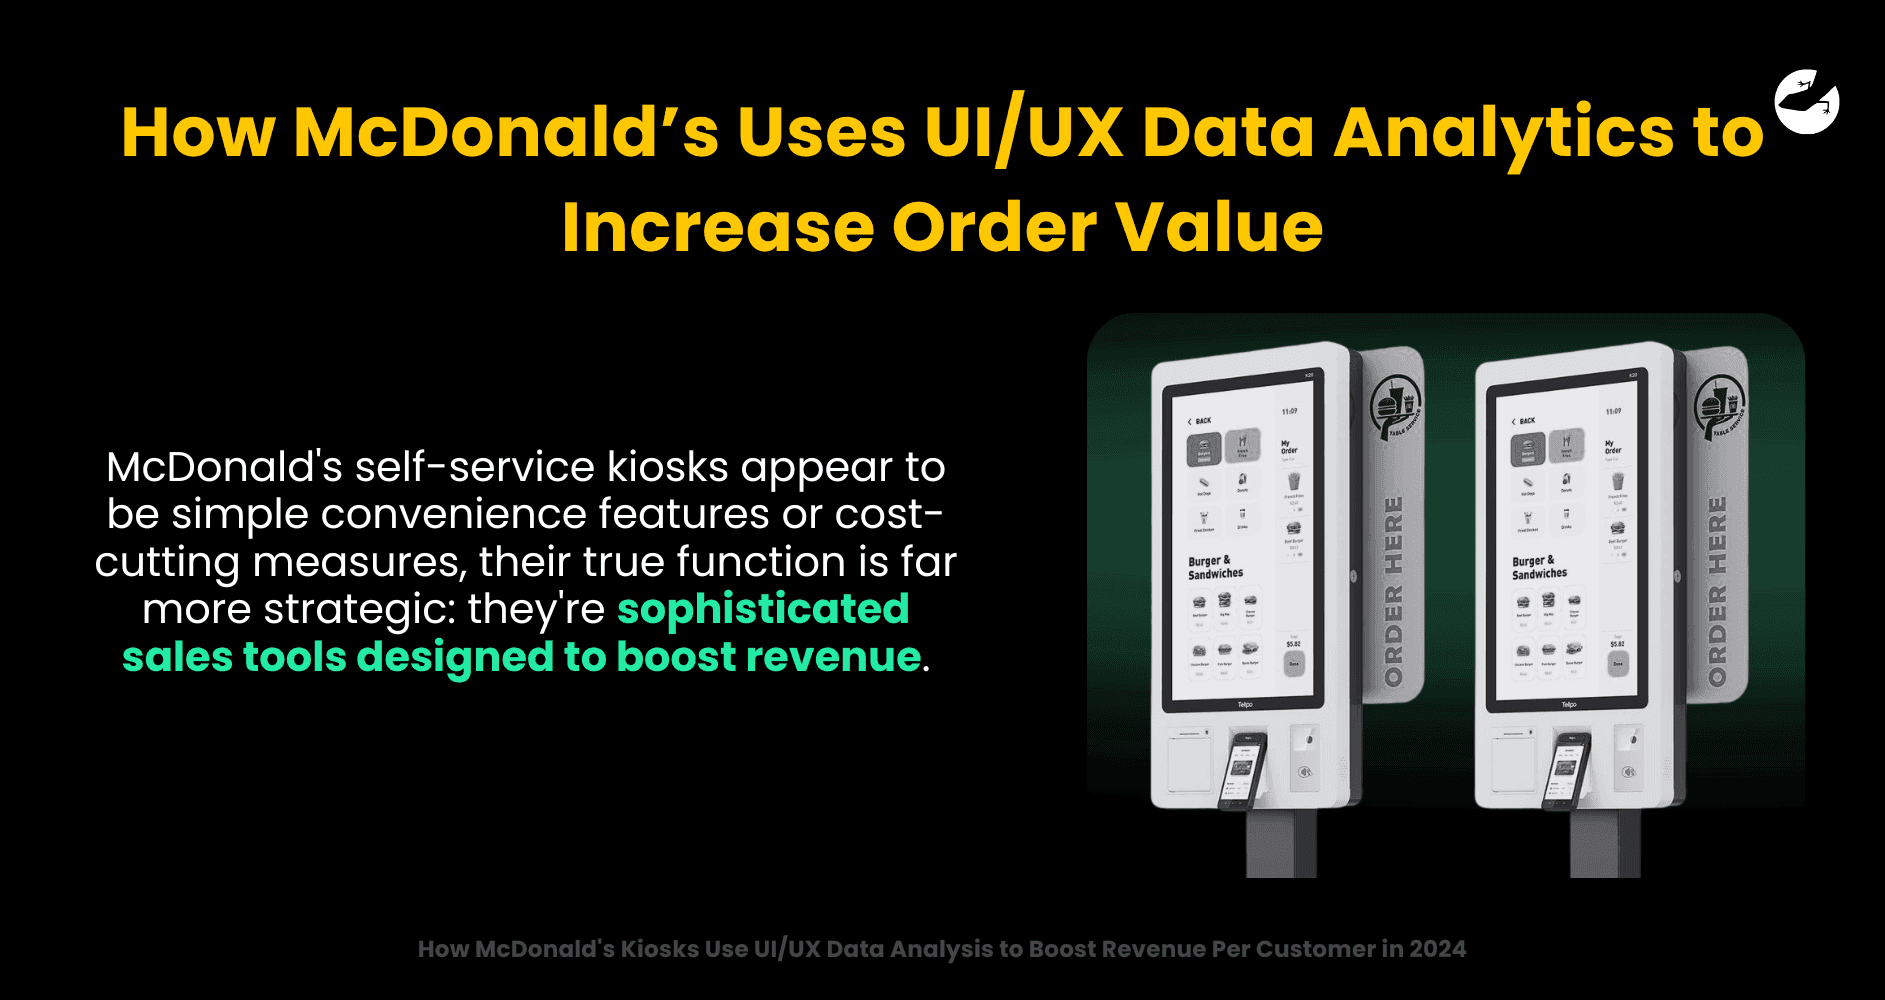
While McDonald's self-service kiosks appear to be simple convenience features or cost-cutting measures, their true function is far more strategic: they're sophisticated sales tools designed to boost revenue.
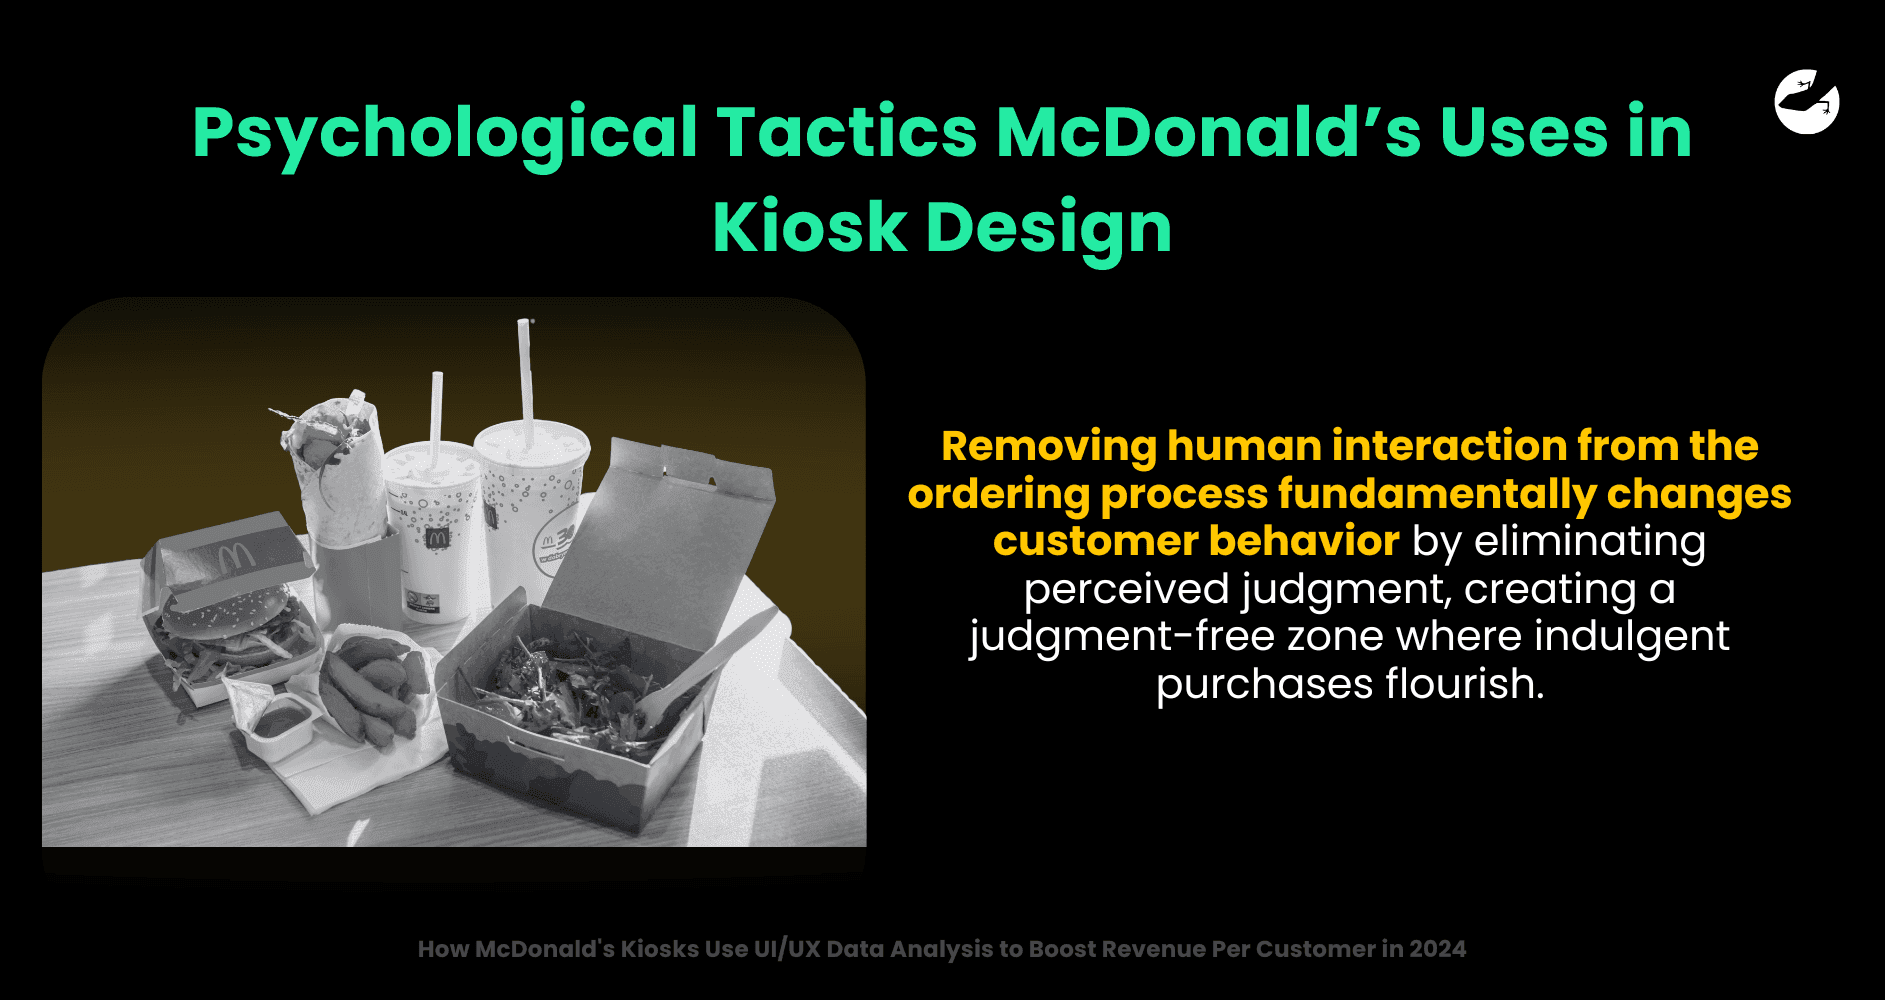
Though customers believe they're gaining autonomy through digital ordering, McDonald's is actually acquiring something far more valuable: predictable, trackable, and scalable customer behavior. The digital interface removes the social pressures that typically constrain spending. No more feeling rushed by the line behind you or judged by a cashier when adding that extra side of fries or dessert for breakfast.
Psychological Tactics McDonald’s Uses in Kiosk Design
The kiosk interface capitalizes on this psychological freedom through strategic visual stimuli: high-definition images of perfectly styled burgers, cold drinks with condensation, and subtle steam effects that trigger cravings.
The interface also uses color psychology. Upsell options feature larger, brighter "YES" buttons while decline options are smaller and more subdued. High-margin items are strategically placed in the ordering flow to maximize exposure.
Customization options (extra bacon, special sauce, upgraded buns) trigger the "IKEA effect." When customers personalize an order, they value it more and become more willing to pay a premium, transforming fast food into a more valuable, customized experience.
Want to find out how much it costs to build your dream app or web app?
UI/UX Metrics That Drive Sales in Self-Service Interfaces
Behind the kiosk interface
lies a rigorous A/B testing process. Everything from button placement and color to text phrasing is continuously optimized for conversion.
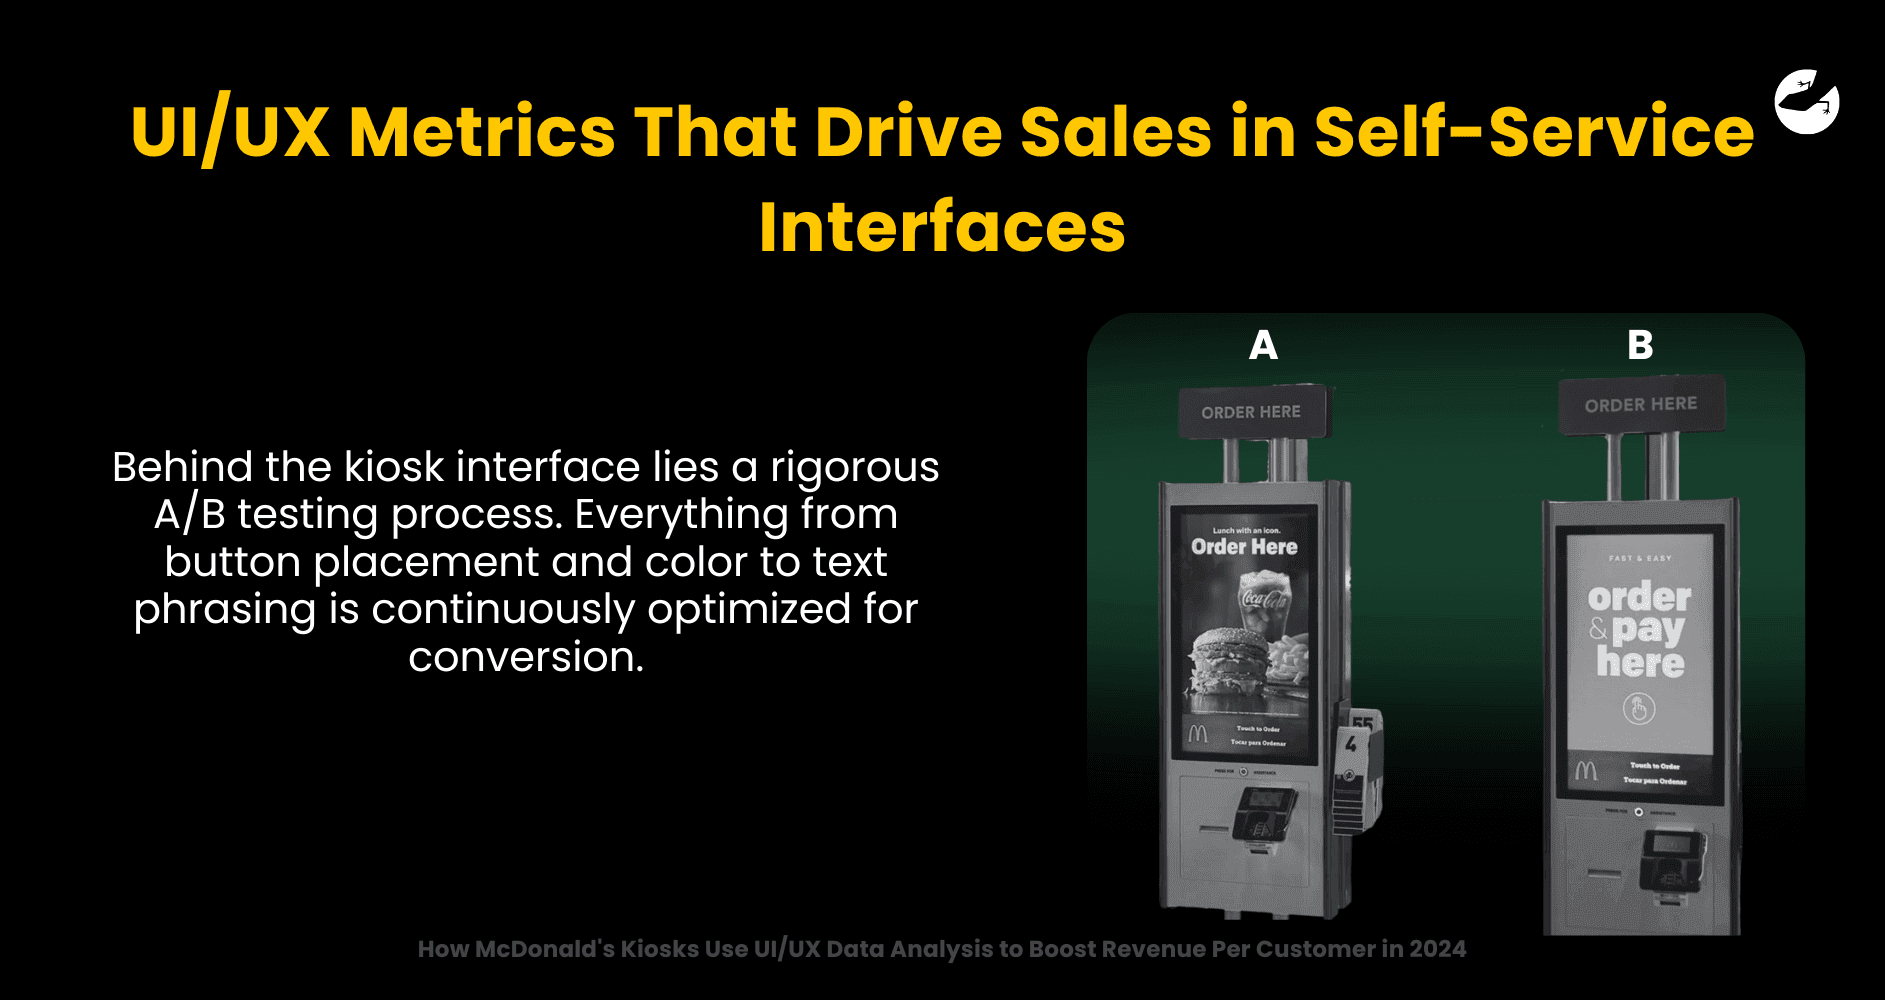
More touches typically mean higher cart values. As customers personalize their order, they naturally move toward more premium options. McDonald's uses visual hierarchy to guide users through high-margin upsells while burying less profitable options in deeper menus.
Through UI/UX Data Analytics, McDonald's identifies key decision points and removes friction
. Reducing steps or offering timely suggestions can dramatically change customer behavior. One of the best examples? The "make it a meal" upsell, which converts over 40% of the time when shown at the right moment.
Every interaction on the kiosk generates data. Every click, scroll, and abandonment builds a customer decision map. Underperforming elements are quickly adjusted based on this real-time feedback.
The system adapts based on region, location, and even time of day. Breakfast deals dominate morning hours in city centers while family bundles rise in suburban dinner slots. The digital menu layout evolves based on performance, ensuring that top sellers are always front and center.
What Businesses Can Learn from McDonald’s UI/UX Strategy
Unlike human cashiers, kiosks don’t forget to upsell or change their tone. They perform consistently and handle multiple orders at once, improving efficiency while cutting labor costs. This consistency builds predictable customer behavior patterns across locations.
Before going global, McDonald’s tested its kiosks in Australia and France. The performance data from these test markets drove refinement before full rollout. The results? Higher order values, better throughput, and improved customer satisfaction scores.
This success story also highlights key principles for building a scalable business through strategic digital implementation.
Customer Perception vs. Engineered UI/UX Reality
At the core of McDonald's kiosk strategy is the illusion of autonomy. Customers feel empowered by digital ordering. They can browse without pressure and make choices at their own pace. But that freedom is carefully guided by design.
Every element, from layout to suggestion timing, nudges customers toward higher spend without them realizing it. The feeling of control masks the engineered path that leads to increased revenue.
Lizard Global, Helping Businesses With Free UI/UX Data Analytics
McDonald’s kiosk success story is a perfect example of how thoughtful UI/UX design, powered by data-driven user experience optimization, can transform a customer experience into a scalable revenue engine. Businesses looking to improve digital interfaces should study this model closely.
At Lizard Global, we help companies apply these same UI/UX data analytics strategies to their own products. From fast-scaling startups to global enterprise platforms, our design and analytics work has helped increase conversion, engagement, and user satisfaction. Because we truly believe in the power of UI/UX data analytics, we include it for free with every new application we deliver. We do this because we’ve seen the results firsthand, and we want our clients to succeed.
Check out our customers' video testimonials or our +60 independently verified Five Star reviews if you like to know more. Let’s connect and make it happen.
Join 2000+ subscribers
Stay in the loop with everything you need to know

McDonald's is transforming the fast-food experience with intelligent UI/UX design and data-driven decision-making. This blog dives into how the brand leverages customer interaction data from digital kiosks to subtly increase order value—without feeling pushy. Learn how smart design choices are driving real business results.
Every time you tap a McDonald’s self-service kiosk, you’re likely spending 15-20% more than if you’d ordered at the counter. This isn’t by accident. Behind the touchscreen lies a masterclass in UI/UX psychology, data analytics, and conversion design all engineered to make you buy more.
Marketed as a convenience tool, the kiosk is actually McDonald’s most consistent upselling employee. And it never forgets its script.
Understanding UI/UX Data Analytics: The Foundation of Digital Experience Optimization
Before diving deeper into McDonald's strategy, let's clarify what UI/UX data analytics actually entails. UI/UX data analytics is the systematic collection, measurement, and analysis of user interactions with digital interfaces to improve user experience and drive business outcomes. It combines design principles with quantitative data to create interfaces that not only satisfy users but also achieve specific business goals.

For businesses implementing UI/UX data analytics, several key metrics typically guide decision-making:
- Conversion Rate: The percentage of users who complete desired actions, such as adding items to cart or completing a purchase. For McDonald's kiosks, a critical conversion metric is the percentage of customers who accept upsell offers.
- Time to Completion: How long users take to complete key tasks. Efficient interfaces minimize unnecessary steps while maximizing value-adding interactions.
- Drop-off Points: Specific moments in the user journey where customers abandon the process. These identify friction points that need redesign.
- Heat Maps: Visual representations showing where users click, tap, or focus attention most frequently, guiding optimal placement of high-value elements.
- Path Analysis: Tracking the sequence of actions users take, revealing natural user flows that can be optimized for business objectives.
By tracking these metrics and continuously testing interface changes, companies can create digital experiences that feel intuitive to users while systematically guiding them toward actions that benefit the business. McDonald's success with kiosks demonstrates how powerful this approach can be when implemented at scale.
How McDonald’s Uses UI/UX Data Analytics to Increase Order Value
While McDonald's self-service kiosks appear to be simple convenience features or cost-cutting measures, their true function is far more strategic: they're sophisticated sales tools designed to boost revenue.

Though customers believe they're gaining autonomy through digital ordering, McDonald's is actually acquiring something far more valuable: predictable, trackable, and scalable customer behavior. The digital interface removes the social pressures that typically constrain spending. No more feeling rushed by the line behind you or judged by a cashier when adding that extra side of fries or dessert for breakfast.
Psychological Tactics McDonald’s Uses in Kiosk Design
The kiosk interface capitalizes on this psychological freedom through strategic visual stimuli: high-definition images of perfectly styled burgers, cold drinks with condensation, and subtle steam effects that trigger cravings.

The interface also uses color psychology. Upsell options feature larger, brighter "YES" buttons while decline options are smaller and more subdued. High-margin items are strategically placed in the ordering flow to maximize exposure.
Customization options (extra bacon, special sauce, upgraded buns) trigger the "IKEA effect." When customers personalize an order, they value it more and become more willing to pay a premium, transforming fast food into a more valuable, customized experience.
Want to find out how much it costs to build your dream app or web app?
UI/UX Metrics That Drive Sales in Self-Service Interfaces
Behind the kiosk interface
lies a rigorous A/B testing process. Everything from button placement and color to text phrasing is continuously optimized for conversion.

More touches typically mean higher cart values. As customers personalize their order, they naturally move toward more premium options. McDonald's uses visual hierarchy to guide users through high-margin upsells while burying less profitable options in deeper menus.
Through UI/UX Data Analytics, McDonald's identifies key decision points and removes friction
. Reducing steps or offering timely suggestions can dramatically change customer behavior. One of the best examples? The "make it a meal" upsell, which converts over 40% of the time when shown at the right moment.
Every interaction on the kiosk generates data. Every click, scroll, and abandonment builds a customer decision map. Underperforming elements are quickly adjusted based on this real-time feedback.
The system adapts based on region, location, and even time of day. Breakfast deals dominate morning hours in city centers while family bundles rise in suburban dinner slots. The digital menu layout evolves based on performance, ensuring that top sellers are always front and center.
What Businesses Can Learn from McDonald’s UI/UX Strategy
Unlike human cashiers, kiosks don’t forget to upsell or change their tone. They perform consistently and handle multiple orders at once, improving efficiency while cutting labor costs. This consistency builds predictable customer behavior patterns across locations.

Before going global, McDonald’s tested its kiosks in Australia and France. The performance data from these test markets drove refinement before full rollout. The results? Higher order values, better throughput, and improved customer satisfaction scores.
This success story also highlights key principles for building a scalable business through strategic digital implementation.
Customer Perception vs. Engineered UI/UX Reality
At the core of McDonald's kiosk strategy is the illusion of autonomy. Customers feel empowered by digital ordering. They can browse without pressure and make choices at their own pace. But that freedom is carefully guided by design.

Every element, from layout to suggestion timing, nudges customers toward higher spend without them realizing it. The feeling of control masks the engineered path that leads to increased revenue.
Lizard Global, Helping Businesses With Free UI/UX Data Analytics
McDonald’s kiosk success story is a perfect example of how thoughtful UI/UX design, powered by data-driven user experience optimization, can transform a customer experience into a scalable revenue engine. Businesses looking to improve digital interfaces should study this model closely.
At Lizard Global, we help companies apply these same UI/UX data analytics strategies to their own products. From fast-scaling startups to global enterprise platforms, our design and analytics work has helped increase conversion, engagement, and user satisfaction. Because we truly believe in the power of UI/UX data analytics, we include it for free with every new application we deliver. We do this because we’ve seen the results firsthand, and we want our clients to succeed.
Check out our customers' video testimonials or our +60 independently verified Five Star reviews if you like to know more. Let’s connect and make it happen.
Join 2000+ subscribers
Stay in the loop with everything you need to know
FAQs

What is UI/UX data analytics?
What metrics are commonly tracked in UI/UX analytics?
How does data analytics improve UX design?
What tools are used for UI/UX analytics?
What’s the difference between UI data and UX data?
How does UI/UX design impact customer spending at McDonald's kiosks?
What kind of data does McDonald’s analyze from its kiosks?
Are these kiosks using AI or machine learning?
Do customers respond positively to these upselling tactics?
Can smaller restaurants adopt similar strategies?


