Lean Analytics
OMTM
+ 2 more ...
Key Aspects & Cycles In Lean Analytics

21 Jun 2024
by Nadiy, Senior Content Writer
21 Jun 2024
by Nadiy, Senior Content Writer
Lean Analytics
OMTM
Lean Methodologies
Data
Key Aspects & Cycles In Lean Analytics
Table of contents
Contact us
We will get back to you in the next 48 hours.
Lean Analytics is a tool that is widely used today, but there are still many that are unaware of what goes into what makes it such a powerful tool.
key takeaways
In today’s fast-paced business environment, making data-driven decisions is essential for success. Lean Analytics, a fundamental part of the Lean Startup methodology provides a dominant framework for both startups and established companies to focus on the metrics that truly matter. By emphasizing validated learning, actionable metrics, and continuous improvement, Lean Analytics helps businesses streamline processes, optimize resource allocation, and drive sustainable growth.
In our blog What Is Lean Analytics, Its Benefits & How To Implement It? we covered the basic understanding of lean analytics and its benefits. In this blog we explore the key aspects and cycles of Lean Analytics, showcasing just how it can transform raw data into valuable insights, enhance decision-making, and drive your business forward. Discover how adopting Lean Analytics can lead to more informed strategies and measurable business success.
Check out our blog on The Importance Of Data to better understand its uses and impact on businesses.
What are key aspects of lean analytics?
There are 4 fundamentally crucial aspects of lean analytics which are data-driven decision making, validated learning, continuous improvement, and one metric that matters.
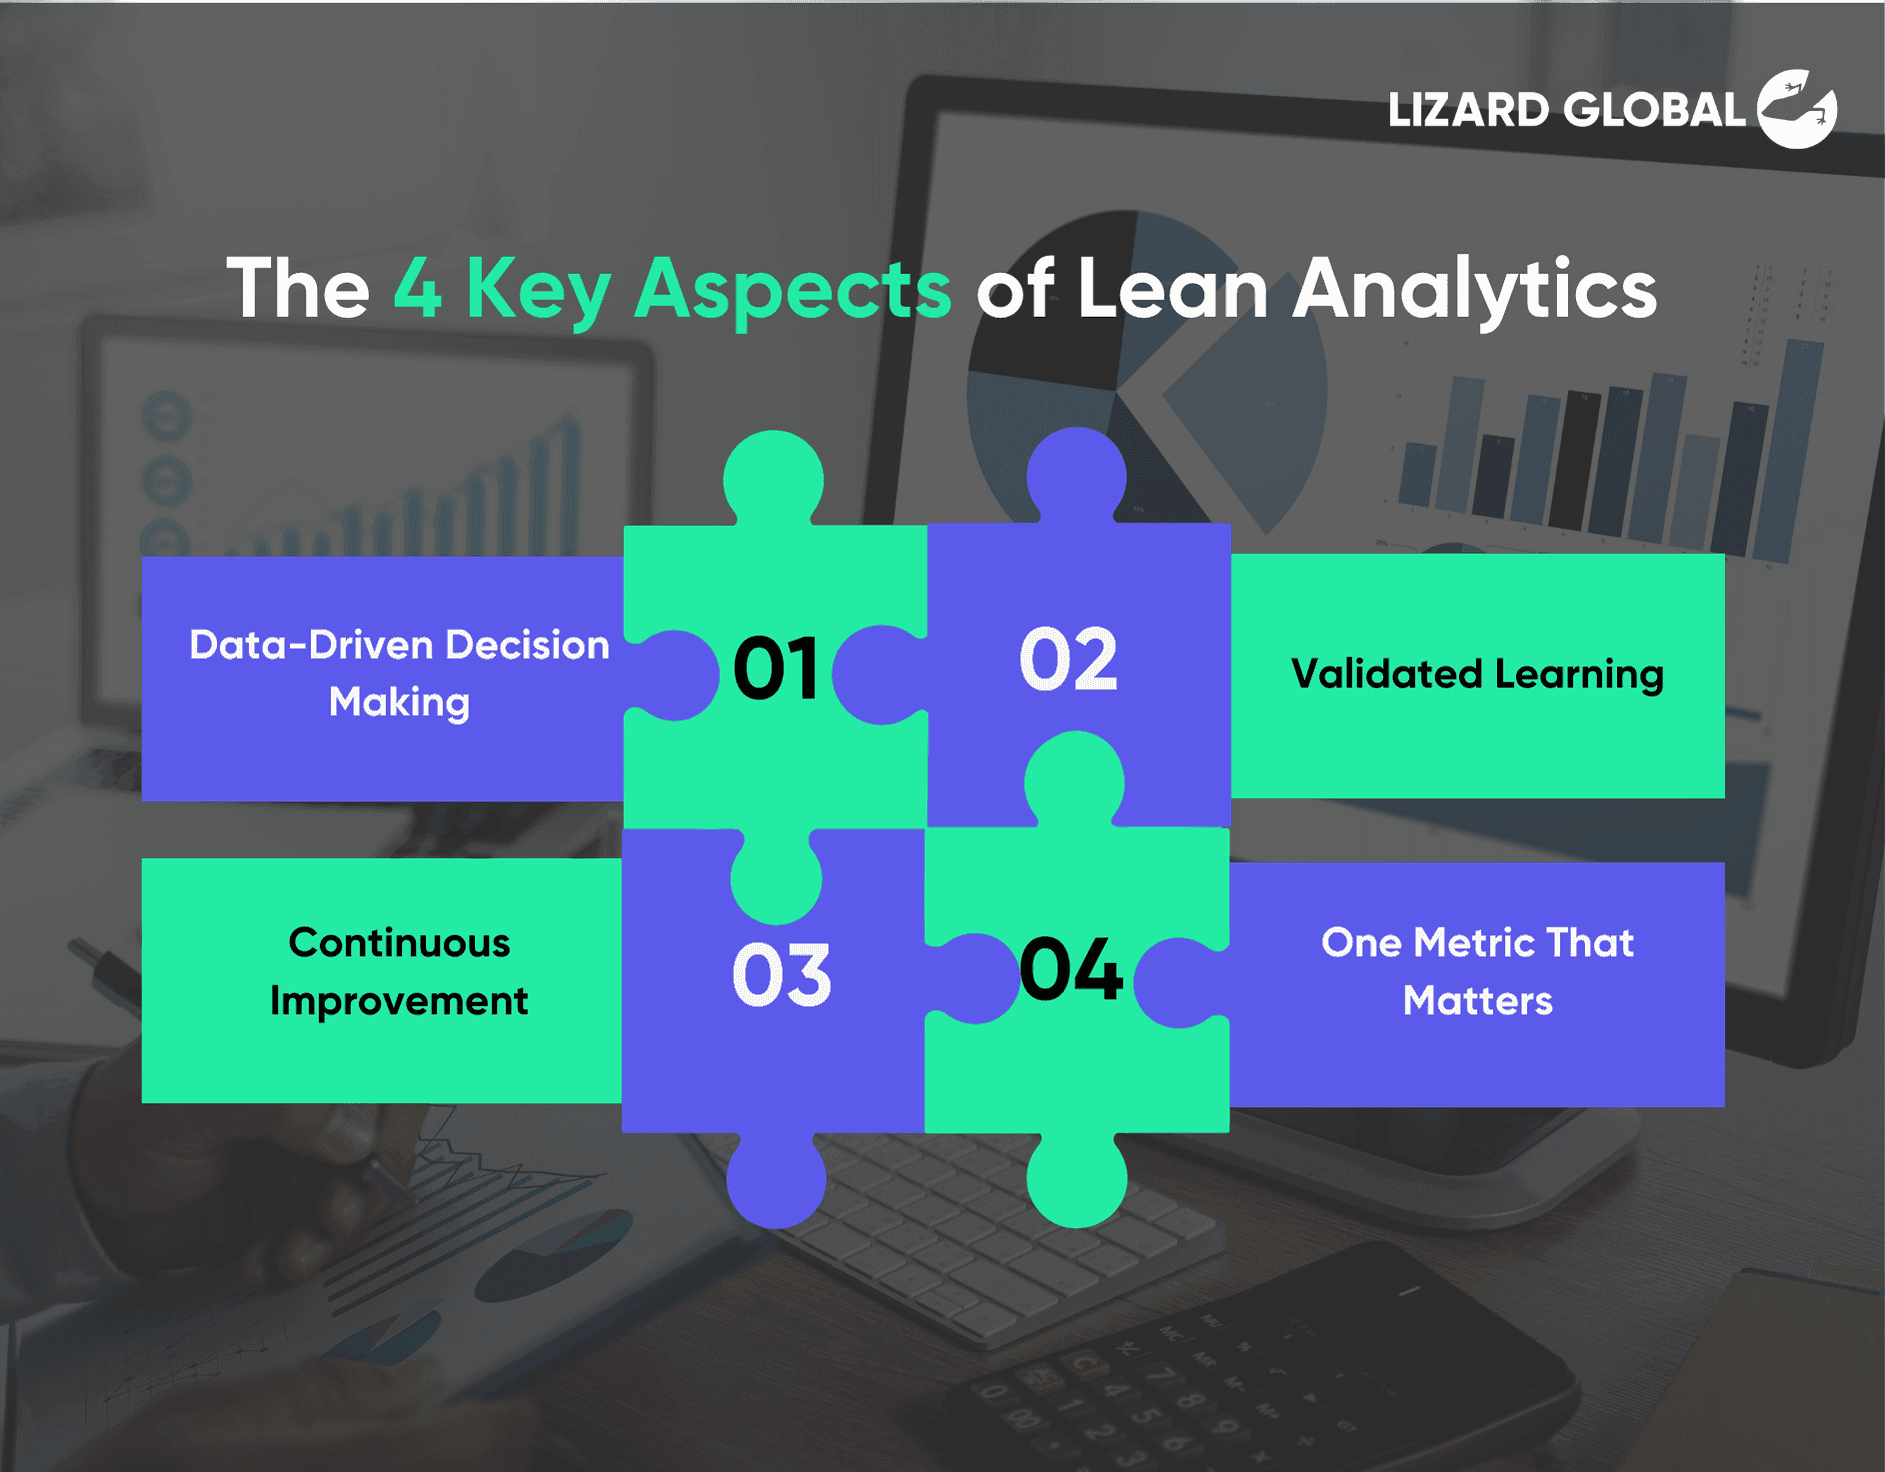
Data-Driven Decision Making
Data-driven decision making is just as its name implies, it is the use of data to make informed decisions rather than intuition or guessing. It involves the process of identifying and tracking KPIs (key performance indicators) that are critical to a business. This is central in lean analytics as it uses empirical data that gives businesses the ability to strategically make their decisions that will put them ahead of their competitors.
For example, in the world of mobile gaming, the developers monitor the user engagement data to distinguish the games popular features. This allows them to then better improve these features leading gamers to be satisfied and the developers to increase their user retention. Here we can see that there was no guesswork involved as the developers made their decision solely based on the data they had collected.
Validated Learning
Validated learning is the process of learning through forming hypotheses and carrying out experiments to validate or invalidate them. These hypotheses usually surround business growth and custom behavior. The experiments allow businesses to gather data and analyze what does and does not work.
For example, say a retail shop hypothesizes by adding a customer review on a particular product or page there will be a rise in sales. So, the shop puts this hypothesis to test adding customer reviews to the product page. By the end of the month their data shows a 25% increase in their sales from pages with customer reviews. This then validates their hypothesis and allows them to fully implement it on all their product pages.
Continuous Improvement
Continuous improvement is a must in lean analytics, as the only way to fully utilize this tool is to use the data obtained and tweak things accordingly. This is simply because the data obtained shows exactly what the customers want and their behavior towards the products and services. Think of it as continuous measurement, analysis, and improvement, rinse and repeat.
A great example of this is Samsung. They are known for their continuous improvement to their mobile devices based on customer feedback. With every iteration of their fold series, Samsung has added features - Fold 1 had a very fragile inner screen that didn’t allow users to fully utilize the phone, with the next two updates especially for Fold 3 the inner screen was upgraded to be able to withstand significantly higher pressure.
Focus on Metrics that Matter
As much as we scream data is crucial for lean analytics, it is wise to remember that not all data is equally valuable. This will vary depending on your business type, scale, and even industry. This is how lean analytics helps businesses identify the data or as it’s called “One Metric That Matters” (OMTM) at various stages of growth making sure businesses focus on the metrics that will be most impactful to them.
For example, a subscription service notices a drop in their customer retention through lean analytics. They are now able to track the churn rate and focus on campaigns targeted at retention like loyalty programs or personalized offers. By focusing on thai particular metric the subscription service reduced their churn by 20%.
Want to find out how much it costs to build your dream app or web app?

What are the cycles in lean analytics?
In lean analytics there are 6 cycles - defining the goals, forming hypotheses, choosing a focus metric, collecting data, analyzing the results, and iterating.
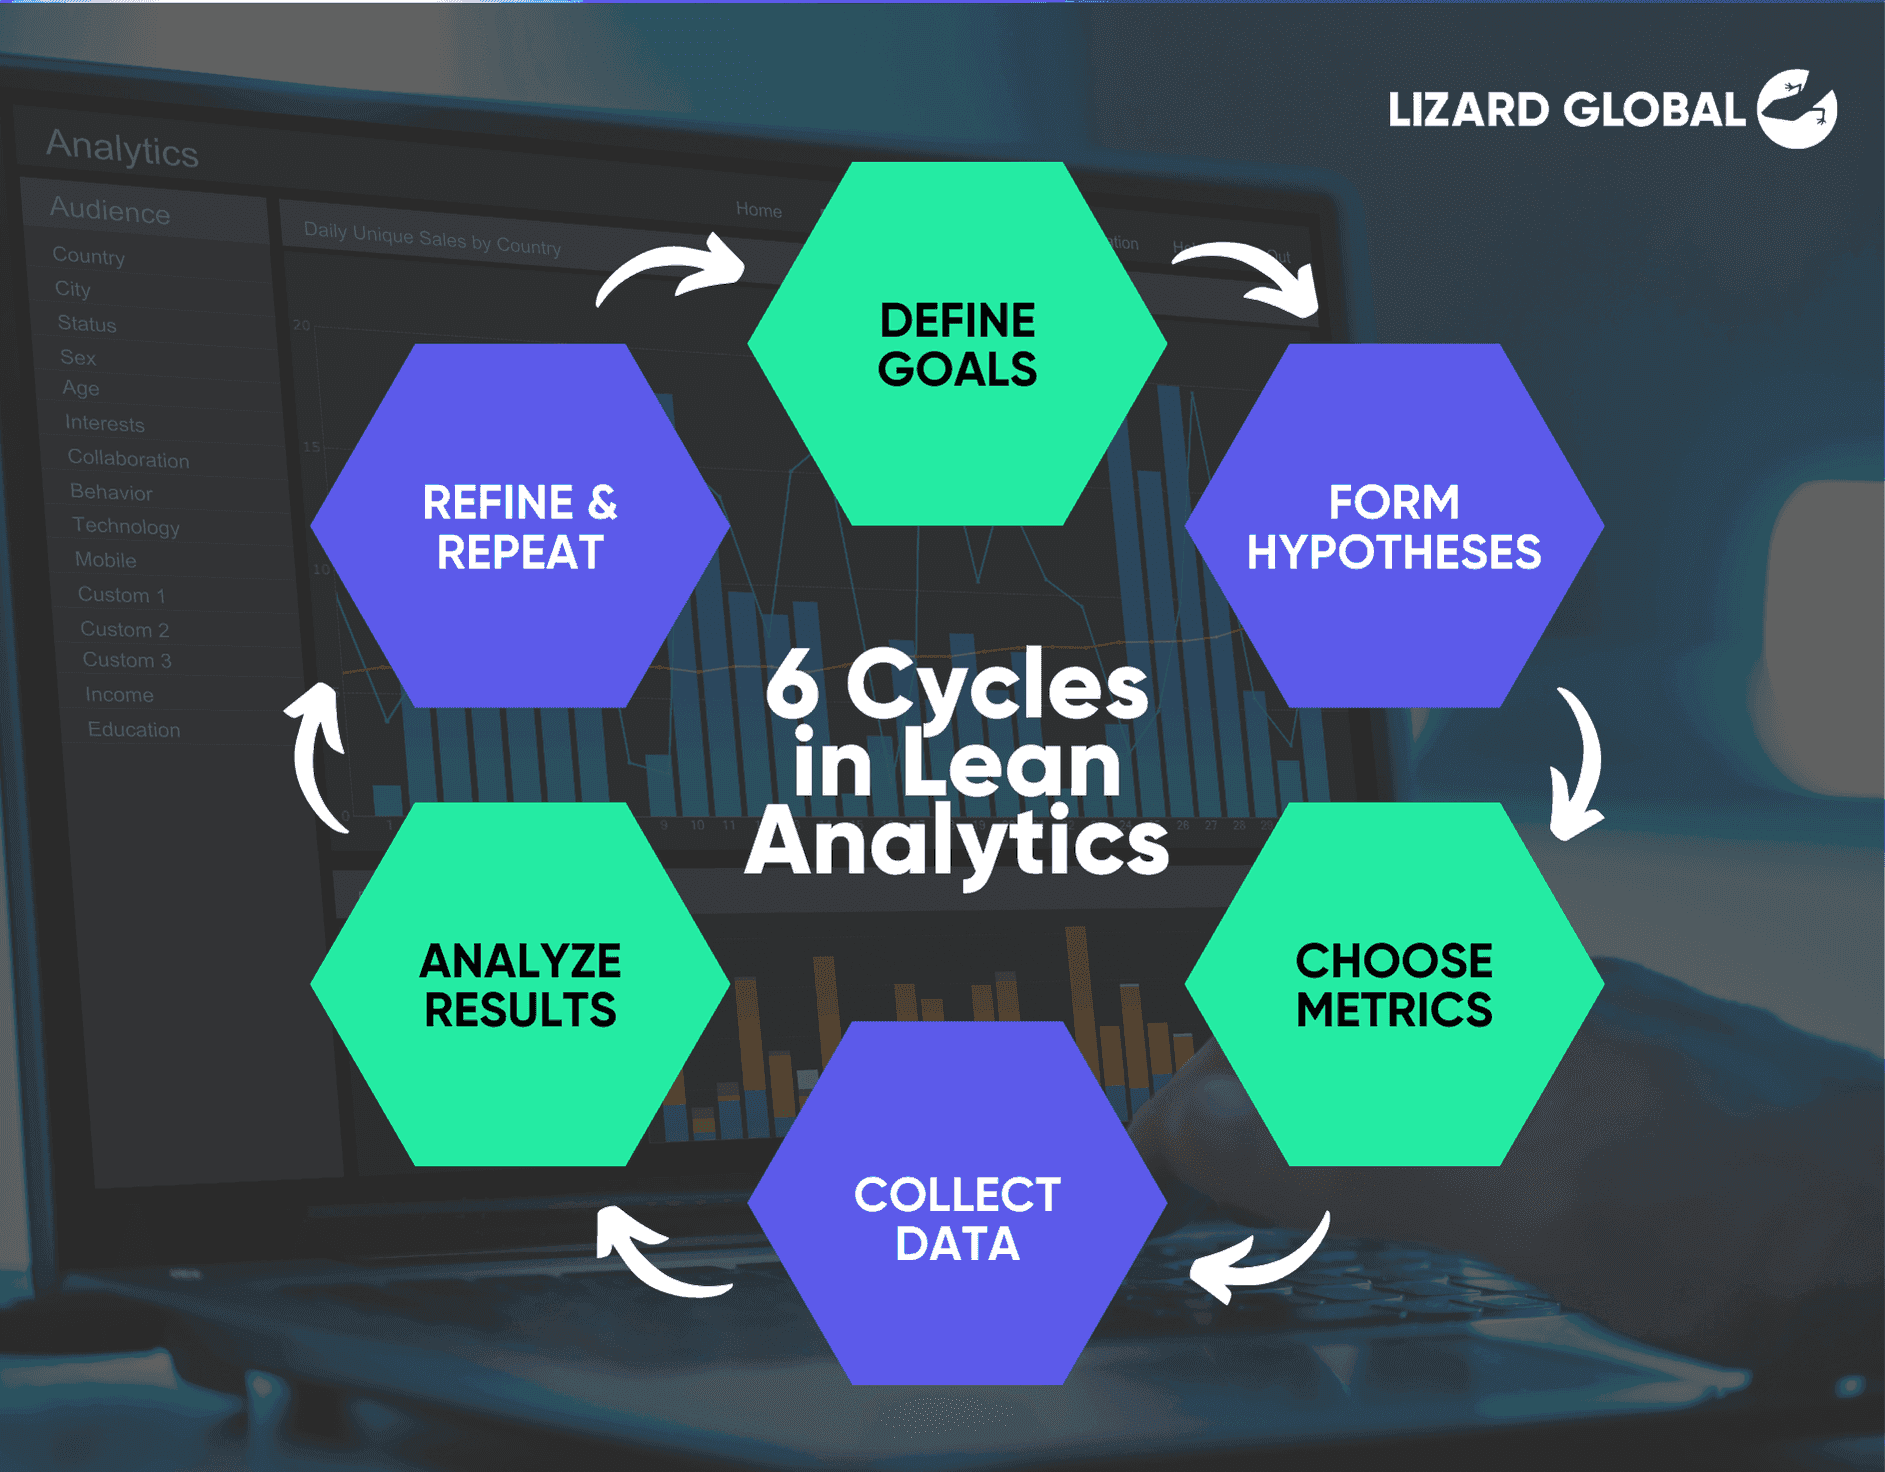
Define Goals
The first and most important thing that needs to be done is defining your goals. Ask yourself “what does success look like for my business?” Don’t hold yourself back, consider this the stage where you have no limitations and list down what your version of a successful business looks like. This can be in terms of revenue, engagement, popularity, user acquisition etc. This will be the basis of all else that follows, so make sure to define it clearly. From that, select the One Metric That Matters (OMTM) or key performance indicators (KPIs) making sure to align it with your goals. Here’s where you establish a baseline to better understand your current performance.
Form Hypotheses
Next comes the hypothesis. Based on the current data you have collected, develop hypotheses about how you can achieve your goals. It is important to prioritize them according to the impact and feasibility they’ll have on your business.
Choose Metrics
Here’s where you test out your hypotheses. Remember OMTM, yeah make sure to hone in on the one and test it accordingly. Ensure that these metrics are accessible, auditable, and can be acted upon.
Collect Data
Data as we’ve mentioned earlier is crucial in lean analytics. It provides raw information that is needed to analyze the performance of your business and to then aid in making the best decision to improve it. So, in this step you’ll need to collect the data whether it is obtained through experiments such as A/B testing, user feedback (SurveyMonkey) or other sources like user reserach doesn’t matter as long as the data is of high quality and is relevant to your goals.
Analyze Results
Here is where you start seeing the fruits of your labor so to speak. This step has you analyzing the data you have gathered to validate or invalidate your hypotheses. It helps you understand how your business is doing through data cleaning which removes any anomalies that could affect the analysis. Once the data is cleaned up, run a trend analysis and comparative analysis to help you summarize the data to focus on identifying patterns and comparing different groups. Depending on the outcomes of the analysis, plot the course for the next steps.
Iterate
At this stage you’ll need to make the changes to your product or strategy based on your analysis. If your hypothesis is validated, proceed with the new and improved implementation. If the hypothesis is invalidated go back to step 2 and form a new set of hypotheses and continue the cycle as per normal. It is very important to continuously refine and repeat the cycles, sometimes with the same OKRs to better understand and improve what’s currently existing, and other times the OKRs change in accordance with your business goals and strategies
Lizard Global and Lean Analytics
Lean Analytics plays a crucial role in our business model, so we understand the importance, weight, and impact it has on a business. Our number one priority is to help our clients conceptualize and develop their digital solution to near perfection. We know what it takes to grow a business in a sustainable way. We ask the right questions and focus on what really matters - realizing your business goals.

Curious about how we can aid in the development and successful growth of your application? Contact us to learn more about Lean Analytics and how we can help you address the unique character and challenges of your business.
Join 2000+ subscribers
Stay in the loop with everything you need to know
Lean Analytics is a tool that is widely used today, but there are still many that are unaware of what goes into what makes it such a powerful tool.
In today’s fast-paced business environment, making data-driven decisions is essential for success. Lean Analytics, a fundamental part of the Lean Startup methodology provides a dominant framework for both startups and established companies to focus on the metrics that truly matter. By emphasizing validated learning, actionable metrics, and continuous improvement, Lean Analytics helps businesses streamline processes, optimize resource allocation, and drive sustainable growth.
In our blog What Is Lean Analytics, Its Benefits & How To Implement It? we covered the basic understanding of lean analytics and its benefits. In this blog we explore the key aspects and cycles of Lean Analytics, showcasing just how it can transform raw data into valuable insights, enhance decision-making, and drive your business forward. Discover how adopting Lean Analytics can lead to more informed strategies and measurable business success.
Check out our blog on The Importance Of Data to better understand its uses and impact on businesses.
What are key aspects of lean analytics?
There are 4 fundamentally crucial aspects of lean analytics which are data-driven decision making, validated learning, continuous improvement, and one metric that matters.
Data-Driven Decision Making
Data-driven decision making is just as its name implies, it is the use of data to make informed decisions rather than intuition or guessing. It involves the process of identifying and tracking KPIs (key performance indicators) that are critical to a business. This is central in lean analytics as it uses empirical data that gives businesses the ability to strategically make their decisions that will put them ahead of their competitors.
For example, in the world of mobile gaming, the developers monitor the user engagement data to distinguish the games popular features. This allows them to then better improve these features leading gamers to be satisfied and the developers to increase their user retention. Here we can see that there was no guesswork involved as the developers made their decision solely based on the data they had collected.
Validated Learning
Validated learning is the process of learning through forming hypotheses and carrying out experiments to validate or invalidate them. These hypotheses usually surround business growth and custom behavior. The experiments allow businesses to gather data and analyze what does and does not work.
For example, say a retail shop hypothesizes by adding a customer review on a particular product or page there will be a rise in sales. So, the shop puts this hypothesis to test adding customer reviews to the product page. By the end of the month their data shows a 25% increase in their sales from pages with customer reviews. This then validates their hypothesis and allows them to fully implement it on all their product pages.
Continuous Improvement
Continuous improvement is a must in lean analytics, as the only way to fully utilize this tool is to use the data obtained and tweak things accordingly. This is simply because the data obtained shows exactly what the customers want and their behavior towards the products and services. Think of it as continuous measurement, analysis, and improvement, rinse and repeat.
A great example of this is Samsung. They are known for their continuous improvement to their mobile devices based on customer feedback. With every iteration of their fold series, Samsung has added features - Fold 1 had a very fragile inner screen that didn’t allow users to fully utilize the phone, with the next two updates especially for Fold 3 the inner screen was upgraded to be able to withstand significantly higher pressure.
Focus on Metrics that Matter
As much as we scream data is crucial for lean analytics, it is wise to remember that not all data is equally valuable. This will vary depending on your business type, scale, and even industry. This is how lean analytics helps businesses identify the data or as it’s called “One Metric That Matters” (OMTM) at various stages of growth making sure businesses focus on the metrics that will be most impactful to them.
For example, a subscription service notices a drop in their customer retention through lean analytics. They are now able to track the churn rate and focus on campaigns targeted at retention like loyalty programs or personalized offers. By focusing on thai particular metric the subscription service reduced their churn by 20%.
Want to find out how much it costs to build your dream app or web app?
What are the cycles in lean analytics?
In lean analytics there are 6 cycles - defining the goals, forming hypotheses, choosing a focus metric, collecting data, analyzing the results, and iterating.
Define Goals
The first and most important thing that needs to be done is defining your goals. Ask yourself “what does success look like for my business?” Don’t hold yourself back, consider this the stage where you have no limitations and list down what your version of a successful business looks like. This can be in terms of revenue, engagement, popularity, user acquisition etc. This will be the basis of all else that follows, so make sure to define it clearly. From that, select the One Metric That Matters (OMTM) or key performance indicators (KPIs) making sure to align it with your goals. Here’s where you establish a baseline to better understand your current performance.
Form Hypotheses
Next comes the hypothesis. Based on the current data you have collected, develop hypotheses about how you can achieve your goals. It is important to prioritize them according to the impact and feasibility they’ll have on your business.
Choose Metrics
Here’s where you test out your hypotheses. Remember OMTM, yeah make sure to hone in on the one and test it accordingly. Ensure that these metrics are accessible, auditable, and can be acted upon.
Collect Data
Data as we’ve mentioned earlier is crucial in lean analytics. It provides raw information that is needed to analyze the performance of your business and to then aid in making the best decision to improve it. So, in this step you’ll need to collect the data whether it is obtained through experiments such as A/B testing, user feedback (SurveyMonkey) or other sources like user reserach doesn’t matter as long as the data is of high quality and is relevant to your goals.
Analyze Results
Here is where you start seeing the fruits of your labor so to speak. This step has you analyzing the data you have gathered to validate or invalidate your hypotheses. It helps you understand how your business is doing through data cleaning which removes any anomalies that could affect the analysis. Once the data is cleaned up, run a trend analysis and comparative analysis to help you summarize the data to focus on identifying patterns and comparing different groups. Depending on the outcomes of the analysis, plot the course for the next steps.
Iterate
At this stage you’ll need to make the changes to your product or strategy based on your analysis. If your hypothesis is validated, proceed with the new and improved implementation. If the hypothesis is invalidated go back to step 2 and form a new set of hypotheses and continue the cycle as per normal. It is very important to continuously refine and repeat the cycles, sometimes with the same OKRs to better understand and improve what’s currently existing, and other times the OKRs change in accordance with your business goals and strategies
Lizard Global and Lean Analytics
Lean Analytics plays a crucial role in our business model, so we understand the importance, weight, and impact it has on a business. Our number one priority is to help our clients conceptualize and develop their digital solution to near perfection. We know what it takes to grow a business in a sustainable way. We ask the right questions and focus on what really matters - realizing your business goals.
Curious about how we can aid in the development and successful growth of your application? Contact us to learn more about Lean Analytics and how we can help you address the unique character and challenges of your business.
Join 2000+ subscribers
Stay in the loop with everything you need to know
FAQs
What's the difference between lean analytics and traditional analytics?
How do I choose the right metrics for my business?
How do I implement lean analytics in my business?
How can lean analytics improve marketing strategies?
What is the importance of setting a baseline in lean analytics?
What are vanity metrics?
Are vanity metrics useful in lean analytics?


Stuck between a great idea and the right team to build it? Let's talk.
We work with corporate innovation teams and ambitious scale-ups across the Netherlands, Singapore, and Australia, and wherever great software needs to be built. Drop us a message and we'll get back to you within one business day.


Markus Monnikendam
Global Commercial Director
hello@lizard.global